Houma vs Immigrants from Croatia Hearing Disability
COMPARE
Houma
Immigrants from Croatia
Hearing Disability
Hearing Disability Comparison
Houma
Immigrants from Croatia
4.2%
HEARING DISABILITY
0.0/ 100
METRIC RATING
332nd/ 347
METRIC RANK
3.1%
HEARING DISABILITY
20.5/ 100
METRIC RATING
198th/ 347
METRIC RANK
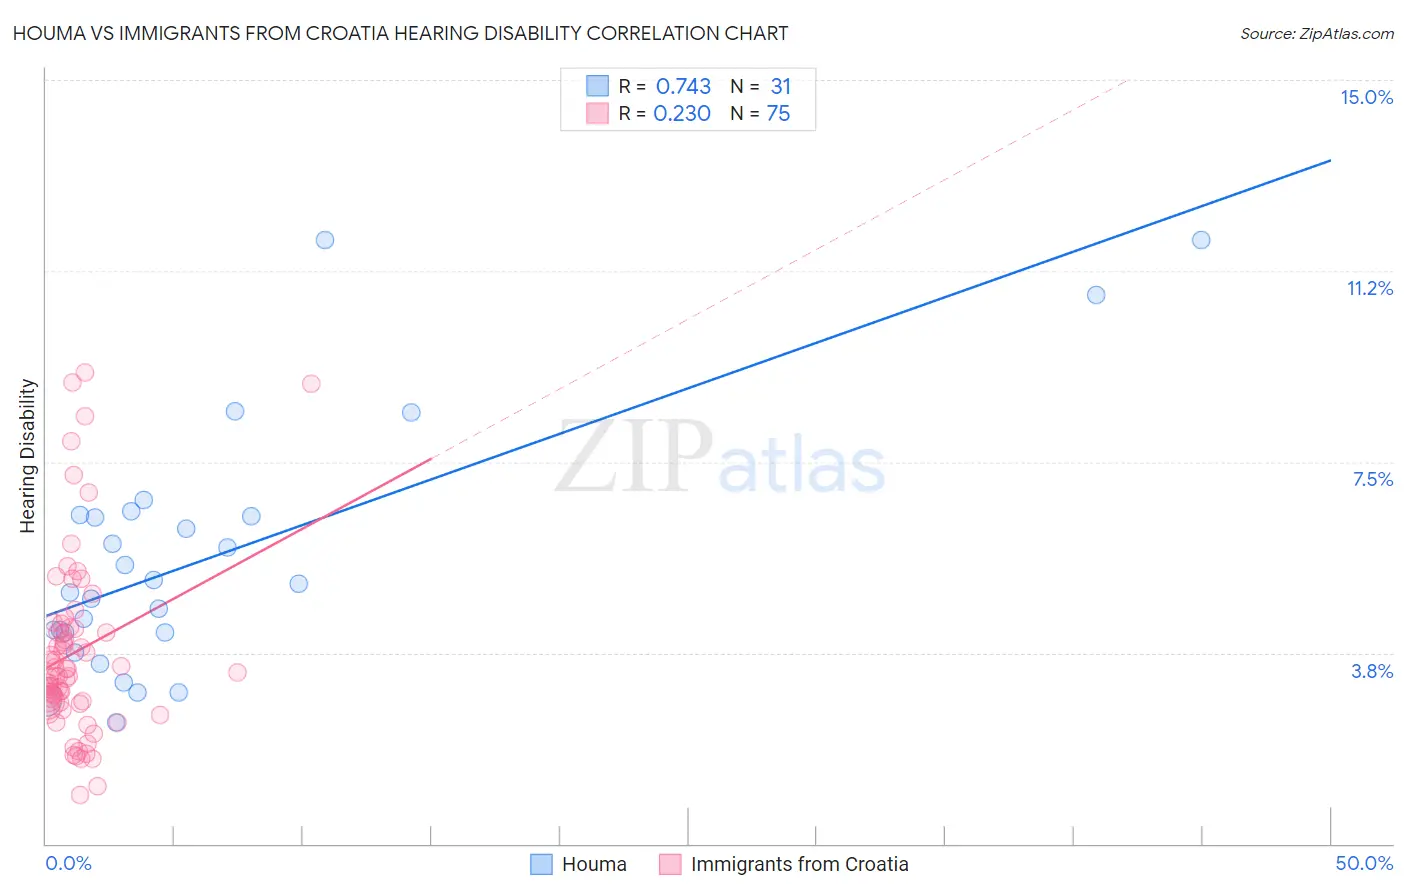
Houma vs Immigrants from Croatia Hearing Disability Correlation Chart
The statistical analysis conducted on geographies consisting of 36,798,453 people shows a strong positive correlation between the proportion of Houma and percentage of population with hearing disability in the United States with a correlation coefficient (R) of 0.743 and weighted average of 4.2%. Similarly, the statistical analysis conducted on geographies consisting of 132,571,835 people shows a weak positive correlation between the proportion of Immigrants from Croatia and percentage of population with hearing disability in the United States with a correlation coefficient (R) of 0.230 and weighted average of 3.1%, a difference of 37.0%.
Hearing Disability Correlation Summary
| Measurement | Houma | Immigrants from Croatia |
| Minimum | 2.4% | 0.95% |
| Maximum | 11.9% | 9.2% |
| Range | 9.5% | 8.3% |
| Mean | 5.6% | 3.8% |
| Median | 5.1% | 3.4% |
| Interquartile 25% (IQ1) | 4.1% | 2.8% |
| Interquartile 75% (IQ3) | 6.5% | 4.2% |
| Interquartile Range (IQR) | 2.3% | 1.5% |
| Standard Deviation (Sample) | 2.5% | 1.8% |
| Standard Deviation (Population) | 2.4% | 1.8% |
Similar Demographics by Hearing Disability
Demographics Similar to Houma by Hearing Disability
In terms of hearing disability, the demographic groups most similar to Houma are Dutch West Indian (4.3%, a difference of 0.59%), Cherokee (4.2%, a difference of 0.68%), Native/Alaskan (4.2%, a difference of 0.83%), Aleut (4.3%, a difference of 1.1%), and Crow (4.2%, a difference of 1.6%).
| Demographics | Rating | Rank | Hearing Disability |
| Lumbee | 0.0 /100 | #325 | Tragic 4.1% |
| Potawatomi | 0.0 /100 | #326 | Tragic 4.1% |
| Arapaho | 0.0 /100 | #327 | Tragic 4.1% |
| Tohono O'odham | 0.0 /100 | #328 | Tragic 4.2% |
| Crow | 0.0 /100 | #329 | Tragic 4.2% |
| Natives/Alaskans | 0.0 /100 | #330 | Tragic 4.2% |
| Cherokee | 0.0 /100 | #331 | Tragic 4.2% |
| Houma | 0.0 /100 | #332 | Tragic 4.2% |
| Dutch West Indians | 0.0 /100 | #333 | Tragic 4.3% |
| Aleuts | 0.0 /100 | #334 | Tragic 4.3% |
| Kiowa | 0.0 /100 | #335 | Tragic 4.3% |
| Creek | 0.0 /100 | #336 | Tragic 4.4% |
| Chickasaw | 0.0 /100 | #337 | Tragic 4.5% |
| Alaska Natives | 0.0 /100 | #338 | Tragic 4.5% |
| Choctaw | 0.0 /100 | #339 | Tragic 4.5% |
Demographics Similar to Immigrants from Croatia by Hearing Disability
In terms of hearing disability, the demographic groups most similar to Immigrants from Croatia are Immigrants from Bosnia and Herzegovina (3.1%, a difference of 0.020%), Syrian (3.1%, a difference of 0.18%), Immigrants from North Macedonia (3.1%, a difference of 0.19%), Iraqi (3.1%, a difference of 0.22%), and Immigrants from Europe (3.1%, a difference of 0.32%).
| Demographics | Rating | Rank | Hearing Disability |
| Immigrants | Switzerland | 28.8 /100 | #191 | Fair 3.1% |
| Koreans | 27.6 /100 | #192 | Fair 3.1% |
| Macedonians | 27.0 /100 | #193 | Fair 3.1% |
| South Africans | 24.5 /100 | #194 | Fair 3.1% |
| Spanish American Indians | 24.1 /100 | #195 | Fair 3.1% |
| Immigrants | Europe | 22.9 /100 | #196 | Fair 3.1% |
| Immigrants | Bosnia and Herzegovina | 20.6 /100 | #197 | Fair 3.1% |
| Immigrants | Croatia | 20.5 /100 | #198 | Fair 3.1% |
| Syrians | 19.2 /100 | #199 | Poor 3.1% |
| Immigrants | North Macedonia | 19.1 /100 | #200 | Poor 3.1% |
| Iraqis | 19.0 /100 | #201 | Poor 3.1% |
| Immigrants | Thailand | 16.4 /100 | #202 | Poor 3.1% |
| Immigrants | Denmark | 16.2 /100 | #203 | Poor 3.1% |
| Immigrants | Czechoslovakia | 15.9 /100 | #204 | Poor 3.1% |
| Alsatians | 15.9 /100 | #205 | Poor 3.1% |