Houma vs Indonesian Hearing Disability
COMPARE
Houma
Indonesian
Hearing Disability
Hearing Disability Comparison
Houma
Indonesians
4.2%
HEARING DISABILITY
0.0/ 100
METRIC RATING
332nd/ 347
METRIC RANK
3.0%
HEARING DISABILITY
50.0/ 100
METRIC RATING
174th/ 347
METRIC RANK
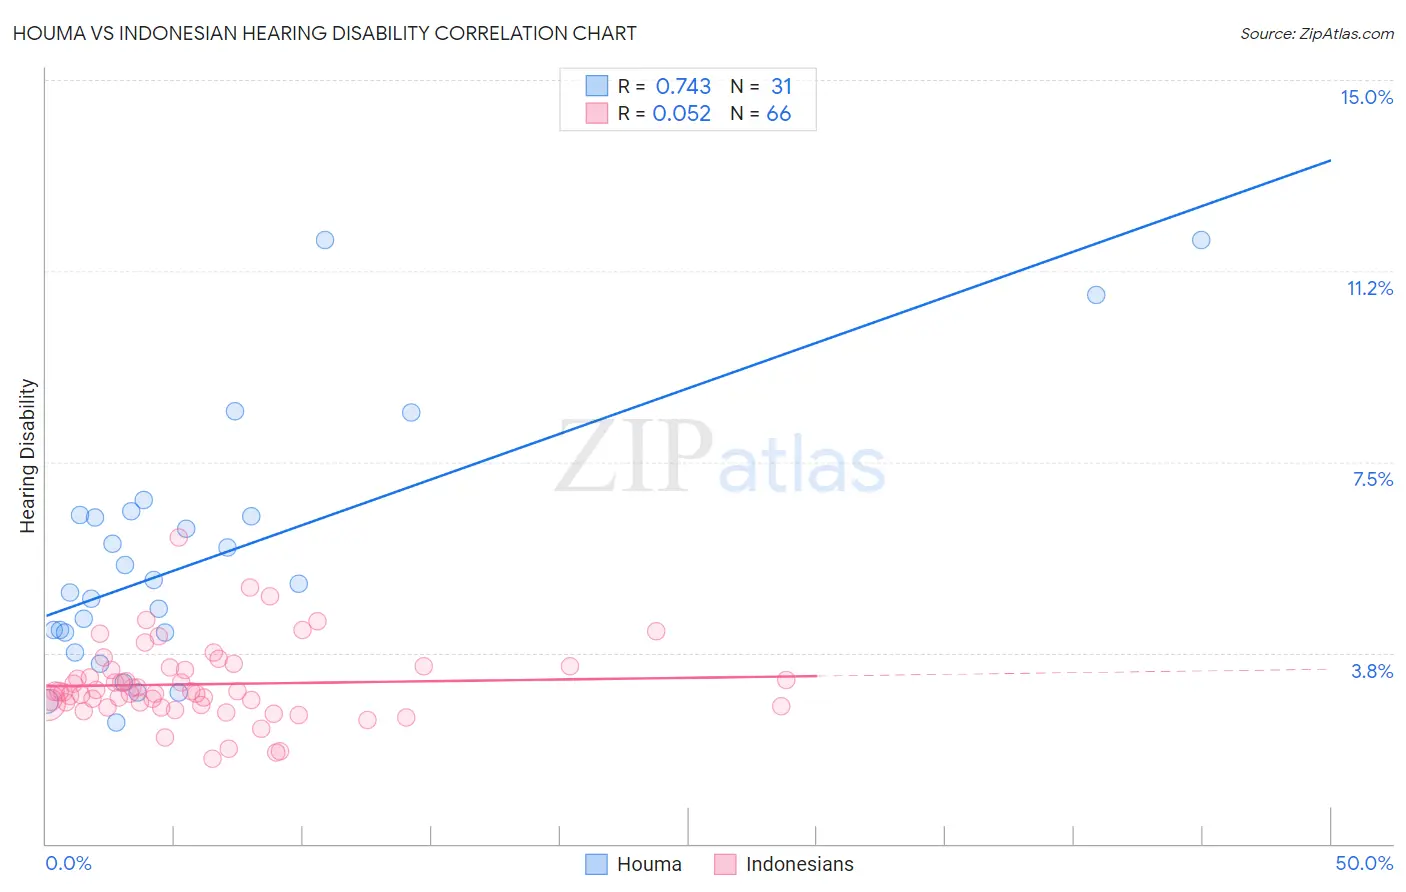
Houma vs Indonesian Hearing Disability Correlation Chart
The statistical analysis conducted on geographies consisting of 36,798,453 people shows a strong positive correlation between the proportion of Houma and percentage of population with hearing disability in the United States with a correlation coefficient (R) of 0.743 and weighted average of 4.2%. Similarly, the statistical analysis conducted on geographies consisting of 162,712,872 people shows a slight positive correlation between the proportion of Indonesians and percentage of population with hearing disability in the United States with a correlation coefficient (R) of 0.052 and weighted average of 3.0%, a difference of 41.3%.
Hearing Disability Correlation Summary
| Measurement | Houma | Indonesian |
| Minimum | 2.4% | 1.7% |
| Maximum | 11.9% | 6.0% |
| Range | 9.5% | 4.3% |
| Mean | 5.6% | 3.1% |
| Median | 5.1% | 3.0% |
| Interquartile 25% (IQ1) | 4.1% | 2.7% |
| Interquartile 75% (IQ3) | 6.5% | 3.5% |
| Interquartile Range (IQR) | 2.3% | 0.72% |
| Standard Deviation (Sample) | 2.5% | 0.76% |
| Standard Deviation (Population) | 2.4% | 0.76% |
Similar Demographics by Hearing Disability
Demographics Similar to Houma by Hearing Disability
In terms of hearing disability, the demographic groups most similar to Houma are Dutch West Indian (4.3%, a difference of 0.59%), Cherokee (4.2%, a difference of 0.68%), Native/Alaskan (4.2%, a difference of 0.83%), Aleut (4.3%, a difference of 1.1%), and Crow (4.2%, a difference of 1.6%).
| Demographics | Rating | Rank | Hearing Disability |
| Lumbee | 0.0 /100 | #325 | Tragic 4.1% |
| Potawatomi | 0.0 /100 | #326 | Tragic 4.1% |
| Arapaho | 0.0 /100 | #327 | Tragic 4.1% |
| Tohono O'odham | 0.0 /100 | #328 | Tragic 4.2% |
| Crow | 0.0 /100 | #329 | Tragic 4.2% |
| Natives/Alaskans | 0.0 /100 | #330 | Tragic 4.2% |
| Cherokee | 0.0 /100 | #331 | Tragic 4.2% |
| Houma | 0.0 /100 | #332 | Tragic 4.2% |
| Dutch West Indians | 0.0 /100 | #333 | Tragic 4.3% |
| Aleuts | 0.0 /100 | #334 | Tragic 4.3% |
| Kiowa | 0.0 /100 | #335 | Tragic 4.3% |
| Creek | 0.0 /100 | #336 | Tragic 4.4% |
| Chickasaw | 0.0 /100 | #337 | Tragic 4.5% |
| Alaska Natives | 0.0 /100 | #338 | Tragic 4.5% |
| Choctaw | 0.0 /100 | #339 | Tragic 4.5% |
Demographics Similar to Indonesians by Hearing Disability
In terms of hearing disability, the demographic groups most similar to Indonesians are Immigrants from Serbia (3.0%, a difference of 0.10%), Immigrants from Romania (3.0%, a difference of 0.15%), Panamanian (3.0%, a difference of 0.28%), Immigrants from Philippines (3.0%, a difference of 0.34%), and Japanese (3.0%, a difference of 0.38%).
| Demographics | Rating | Rank | Hearing Disability |
| Immigrants | Eastern Europe | 58.1 /100 | #167 | Average 3.0% |
| Immigrants | Greece | 57.9 /100 | #168 | Average 3.0% |
| Arabs | 57.6 /100 | #169 | Average 3.0% |
| Immigrants | Cabo Verde | 56.9 /100 | #170 | Average 3.0% |
| Immigrants | Ukraine | 56.6 /100 | #171 | Average 3.0% |
| Armenians | 56.0 /100 | #172 | Average 3.0% |
| Immigrants | Serbia | 51.1 /100 | #173 | Average 3.0% |
| Indonesians | 50.0 /100 | #174 | Average 3.0% |
| Immigrants | Romania | 48.4 /100 | #175 | Average 3.0% |
| Panamanians | 47.0 /100 | #176 | Average 3.0% |
| Immigrants | Philippines | 46.4 /100 | #177 | Average 3.0% |
| Japanese | 46.0 /100 | #178 | Average 3.0% |
| Immigrants | Moldova | 43.1 /100 | #179 | Average 3.0% |
| Immigrants | Sweden | 42.4 /100 | #180 | Average 3.0% |
| Immigrants | Belgium | 41.5 /100 | #181 | Average 3.0% |