Houma vs Bangladeshi Householder Income Ages 25 - 44 years
COMPARE
Houma
Bangladeshi
Householder Income Ages 25 - 44 years
Householder Income Ages 25 - 44 years Comparison
Houma
Bangladeshis
$77,044
HOUSEHOLDER INCOME AGES 25 - 44 YEARS
0.0/ 100
METRIC RATING
326th/ 347
METRIC RANK
$81,363
HOUSEHOLDER INCOME AGES 25 - 44 YEARS
0.1/ 100
METRIC RATING
295th/ 347
METRIC RANK
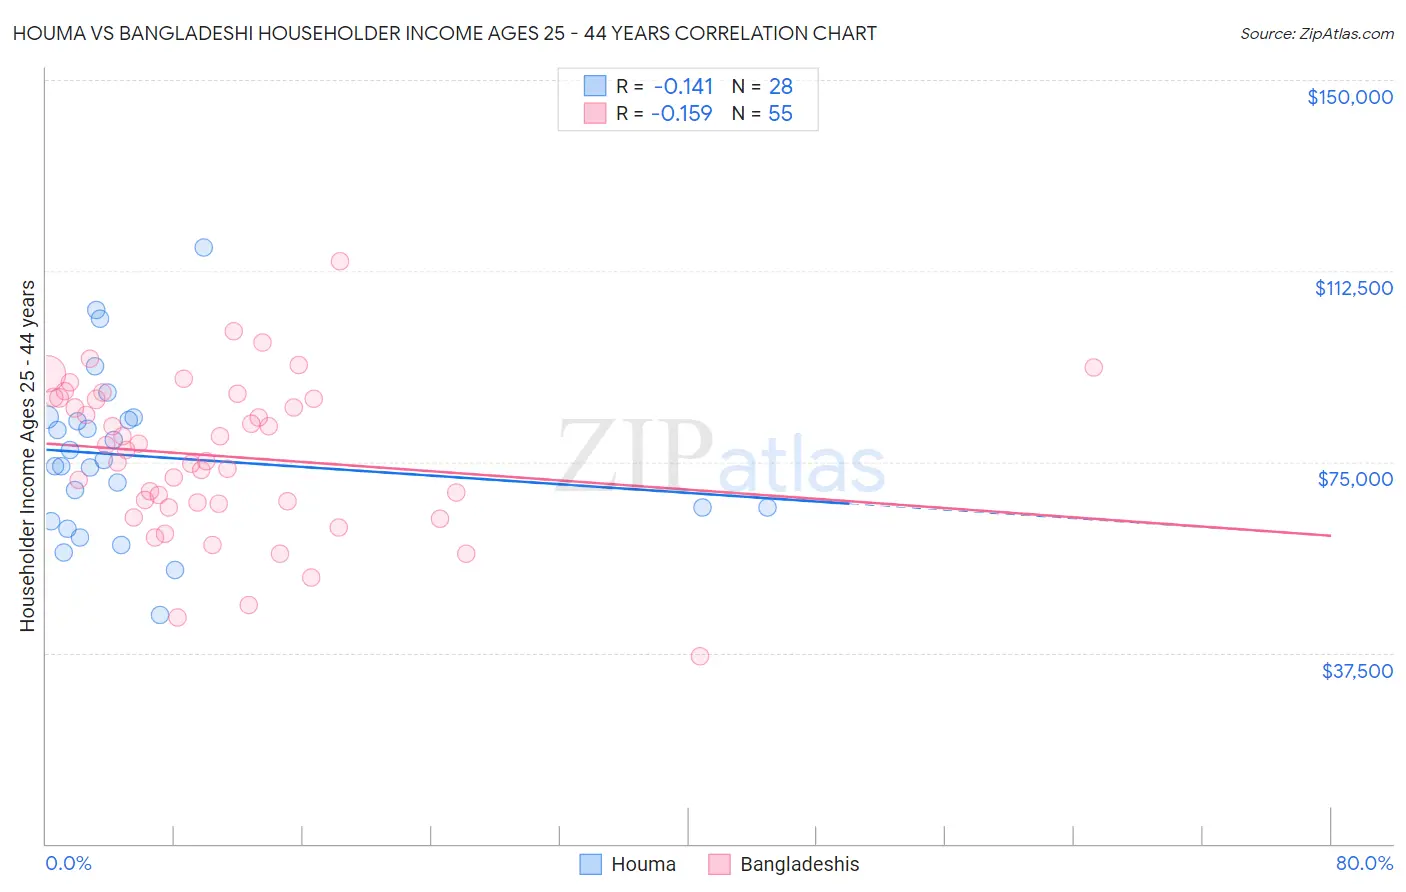
Houma vs Bangladeshi Householder Income Ages 25 - 44 years Correlation Chart
The statistical analysis conducted on geographies consisting of 36,744,797 people shows a poor negative correlation between the proportion of Houma and household income with householder between the ages 25 and 44 in the United States with a correlation coefficient (R) of -0.141 and weighted average of $77,044. Similarly, the statistical analysis conducted on geographies consisting of 141,274,107 people shows a poor negative correlation between the proportion of Bangladeshis and household income with householder between the ages 25 and 44 in the United States with a correlation coefficient (R) of -0.159 and weighted average of $81,363, a difference of 5.6%.
Householder Income Ages 25 - 44 years Correlation Summary
| Measurement | Houma | Bangladeshi |
| Minimum | $44,839 | $36,818 |
| Maximum | $117,083 | $114,417 |
| Range | $72,244 | $77,599 |
| Mean | $76,117 | $76,117 |
| Median | $74,711 | $77,308 |
| Interquartile 25% (IQ1) | $64,767 | $66,732 |
| Interquartile 75% (IQ3) | $83,511 | $87,531 |
| Interquartile Range (IQR) | $18,745 | $20,799 |
| Standard Deviation (Sample) | $16,133 | $15,116 |
| Standard Deviation (Population) | $15,843 | $14,978 |
Similar Demographics by Householder Income Ages 25 - 44 years
Demographics Similar to Houma by Householder Income Ages 25 - 44 years
In terms of householder income ages 25 - 44 years, the demographic groups most similar to Houma are Sioux ($77,089, a difference of 0.060%), Immigrants from Bahamas ($76,910, a difference of 0.17%), Dutch West Indian ($77,260, a difference of 0.28%), Immigrants from Honduras ($77,328, a difference of 0.37%), and Immigrants from Cuba ($76,701, a difference of 0.45%).
| Demographics | Rating | Rank | Householder Income Ages 25 - 44 years |
| Hondurans | 0.0 /100 | #319 | Tragic $78,540 |
| Choctaw | 0.0 /100 | #320 | Tragic $78,168 |
| Immigrants | Zaire | 0.0 /100 | #321 | Tragic $78,045 |
| Chickasaw | 0.0 /100 | #322 | Tragic $77,929 |
| Immigrants | Honduras | 0.0 /100 | #323 | Tragic $77,328 |
| Dutch West Indians | 0.0 /100 | #324 | Tragic $77,260 |
| Sioux | 0.0 /100 | #325 | Tragic $77,089 |
| Houma | 0.0 /100 | #326 | Tragic $77,044 |
| Immigrants | Bahamas | 0.0 /100 | #327 | Tragic $76,910 |
| Immigrants | Cuba | 0.0 /100 | #328 | Tragic $76,701 |
| Seminole | 0.0 /100 | #329 | Tragic $76,584 |
| Yakama | 0.0 /100 | #330 | Tragic $76,226 |
| Natives/Alaskans | 0.0 /100 | #331 | Tragic $75,647 |
| Bahamians | 0.0 /100 | #332 | Tragic $75,395 |
| Hopi | 0.0 /100 | #333 | Tragic $75,002 |
Demographics Similar to Bangladeshis by Householder Income Ages 25 - 44 years
In terms of householder income ages 25 - 44 years, the demographic groups most similar to Bangladeshis are Immigrants from Dominica ($81,351, a difference of 0.020%), Immigrants from Guatemala ($81,341, a difference of 0.030%), Cuban ($81,483, a difference of 0.15%), Dominican ($81,229, a difference of 0.17%), and Blackfeet ($81,531, a difference of 0.21%).
| Demographics | Rating | Rank | Householder Income Ages 25 - 44 years |
| Comanche | 0.1 /100 | #288 | Tragic $82,152 |
| Shoshone | 0.1 /100 | #289 | Tragic $82,062 |
| Liberians | 0.1 /100 | #290 | Tragic $82,005 |
| Potawatomi | 0.1 /100 | #291 | Tragic $81,774 |
| Yaqui | 0.1 /100 | #292 | Tragic $81,656 |
| Blackfeet | 0.1 /100 | #293 | Tragic $81,531 |
| Cubans | 0.1 /100 | #294 | Tragic $81,483 |
| Bangladeshis | 0.1 /100 | #295 | Tragic $81,363 |
| Immigrants | Dominica | 0.1 /100 | #296 | Tragic $81,351 |
| Immigrants | Guatemala | 0.1 /100 | #297 | Tragic $81,341 |
| Dominicans | 0.1 /100 | #298 | Tragic $81,229 |
| Immigrants | Liberia | 0.1 /100 | #299 | Tragic $80,863 |
| Cherokee | 0.0 /100 | #300 | Tragic $80,843 |
| Immigrants | Micronesia | 0.0 /100 | #301 | Tragic $80,544 |
| Hispanics or Latinos | 0.0 /100 | #302 | Tragic $80,515 |