Immigrants from Zaire vs Immigrants from Senegal Cognitive Disability
COMPARE
Immigrants from Zaire
Immigrants from Senegal
Cognitive Disability
Cognitive Disability Comparison
Immigrants from Zaire
Immigrants from Senegal
19.4%
COGNITIVE DISABILITY
0.0/ 100
METRIC RATING
343rd/ 347
METRIC RANK
18.7%
COGNITIVE DISABILITY
0.0/ 100
METRIC RATING
326th/ 347
METRIC RANK
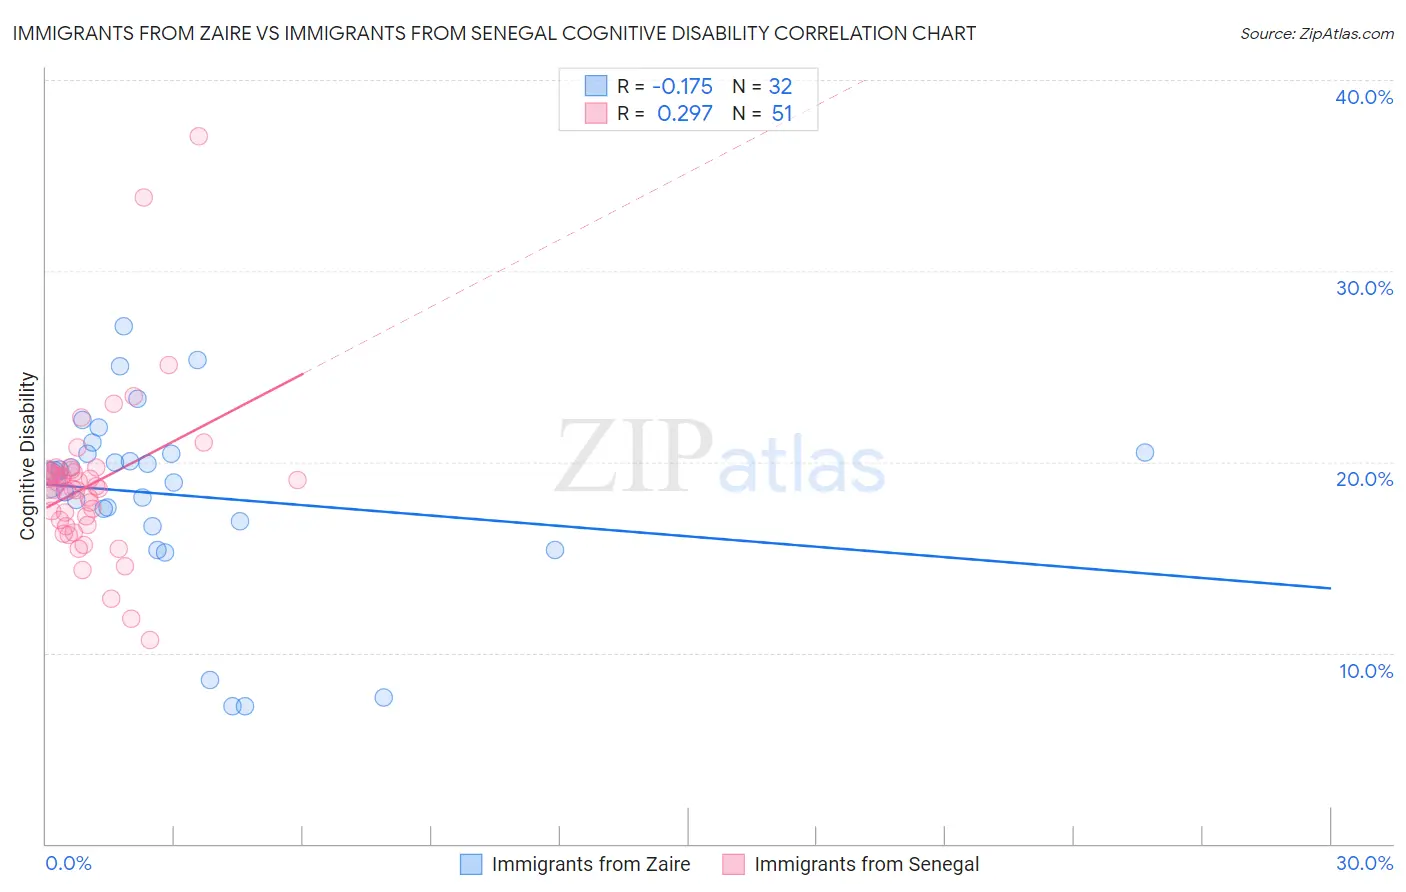
Immigrants from Zaire vs Immigrants from Senegal Cognitive Disability Correlation Chart
The statistical analysis conducted on geographies consisting of 107,255,223 people shows a poor negative correlation between the proportion of Immigrants from Zaire and percentage of population with cognitive disability in the United States with a correlation coefficient (R) of -0.175 and weighted average of 19.4%. Similarly, the statistical analysis conducted on geographies consisting of 90,129,295 people shows a weak positive correlation between the proportion of Immigrants from Senegal and percentage of population with cognitive disability in the United States with a correlation coefficient (R) of 0.297 and weighted average of 18.7%, a difference of 3.7%.
Cognitive Disability Correlation Summary
| Measurement | Immigrants from Zaire | Immigrants from Senegal |
| Minimum | 7.2% | 10.7% |
| Maximum | 27.1% | 37.0% |
| Range | 19.9% | 26.4% |
| Mean | 18.2% | 18.8% |
| Median | 19.3% | 18.6% |
| Interquartile 25% (IQ1) | 16.8% | 16.7% |
| Interquartile 75% (IQ3) | 20.5% | 19.5% |
| Interquartile Range (IQR) | 3.7% | 2.8% |
| Standard Deviation (Sample) | 4.9% | 4.3% |
| Standard Deviation (Population) | 4.8% | 4.3% |
Demographics Similar to Immigrants from Zaire and Immigrants from Senegal by Cognitive Disability
In terms of cognitive disability, the demographic groups most similar to Immigrants from Zaire are Tohono O'odham (19.3%, a difference of 0.69%), Houma (19.3%, a difference of 0.69%), Cape Verdean (19.2%, a difference of 0.93%), Puerto Rican (19.2%, a difference of 0.96%), and Lumbee (19.1%, a difference of 1.4%). Similarly, the demographic groups most similar to Immigrants from Senegal are Indonesian (18.7%, a difference of 0.020%), U.S. Virgin Islander (18.7%, a difference of 0.040%), Dominican (18.7%, a difference of 0.10%), Kiowa (18.7%, a difference of 0.10%), and Navajo (18.8%, a difference of 0.33%).
| Demographics | Rating | Rank | Cognitive Disability |
| Dominicans | 0.0 /100 | #324 | Tragic 18.7% |
| Indonesians | 0.0 /100 | #325 | Tragic 18.7% |
| Immigrants | Senegal | 0.0 /100 | #326 | Tragic 18.7% |
| U.S. Virgin Islanders | 0.0 /100 | #327 | Tragic 18.7% |
| Kiowa | 0.0 /100 | #328 | Tragic 18.7% |
| Navajo | 0.0 /100 | #329 | Tragic 18.8% |
| Immigrants | Dominican Republic | 0.0 /100 | #330 | Tragic 18.8% |
| Pima | 0.0 /100 | #331 | Tragic 18.8% |
| Immigrants | Sudan | 0.0 /100 | #332 | Tragic 18.8% |
| Immigrants | Yemen | 0.0 /100 | #333 | Tragic 18.8% |
| Sudanese | 0.0 /100 | #334 | Tragic 18.9% |
| Senegalese | 0.0 /100 | #335 | Tragic 19.0% |
| Blacks/African Americans | 0.0 /100 | #336 | Tragic 19.0% |
| Immigrants | Saudi Arabia | 0.0 /100 | #337 | Tragic 19.1% |
| Lumbee | 0.0 /100 | #338 | Tragic 19.1% |
| Puerto Ricans | 0.0 /100 | #339 | Tragic 19.2% |
| Cape Verdeans | 0.0 /100 | #340 | Tragic 19.2% |
| Tohono O'odham | 0.0 /100 | #341 | Tragic 19.3% |
| Houma | 0.0 /100 | #342 | Tragic 19.3% |
| Immigrants | Zaire | 0.0 /100 | #343 | Tragic 19.4% |
| Immigrants | Congo | 0.0 /100 | #344 | Tragic 19.7% |