Costa Rican vs Immigrants from Senegal Cognitive Disability
COMPARE
Costa Rican
Immigrants from Senegal
Cognitive Disability
Cognitive Disability Comparison
Costa Ricans
Immigrants from Senegal
17.0%
COGNITIVE DISABILITY
88.0/ 100
METRIC RATING
146th/ 347
METRIC RANK
18.7%
COGNITIVE DISABILITY
0.0/ 100
METRIC RATING
326th/ 347
METRIC RANK
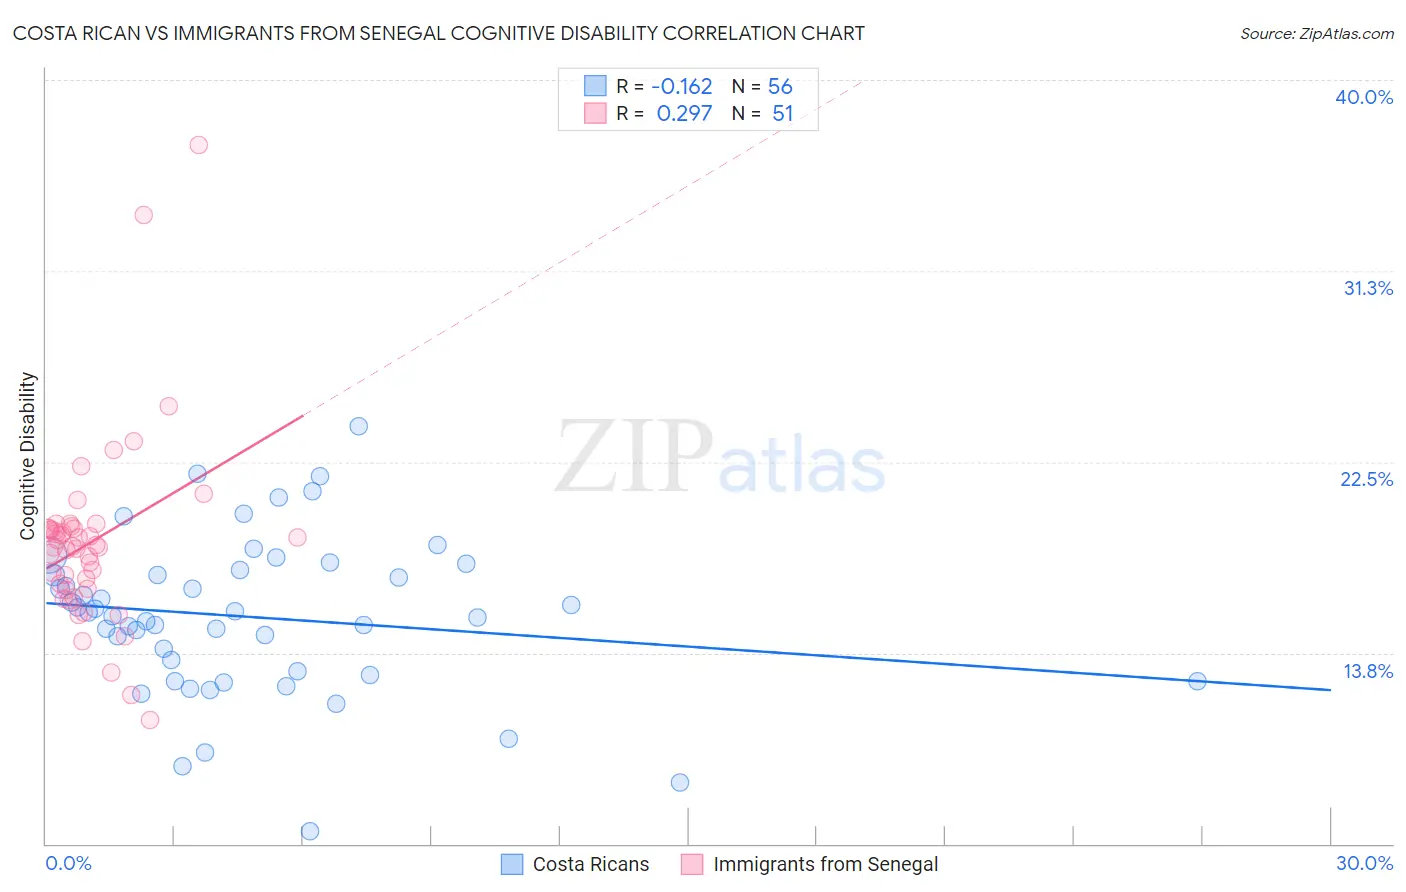
Costa Rican vs Immigrants from Senegal Cognitive Disability Correlation Chart
The statistical analysis conducted on geographies consisting of 253,564,903 people shows a poor negative correlation between the proportion of Costa Ricans and percentage of population with cognitive disability in the United States with a correlation coefficient (R) of -0.162 and weighted average of 17.0%. Similarly, the statistical analysis conducted on geographies consisting of 90,129,295 people shows a weak positive correlation between the proportion of Immigrants from Senegal and percentage of population with cognitive disability in the United States with a correlation coefficient (R) of 0.297 and weighted average of 18.7%, a difference of 9.8%.
Cognitive Disability Correlation Summary
| Measurement | Costa Rican | Immigrants from Senegal |
| Minimum | 5.6% | 10.7% |
| Maximum | 24.1% | 37.0% |
| Range | 18.5% | 26.4% |
| Mean | 15.4% | 18.8% |
| Median | 15.5% | 18.6% |
| Interquartile 25% (IQ1) | 12.8% | 16.7% |
| Interquartile 75% (IQ3) | 17.4% | 19.5% |
| Interquartile Range (IQR) | 4.6% | 2.8% |
| Standard Deviation (Sample) | 3.6% | 4.3% |
| Standard Deviation (Population) | 3.6% | 4.3% |
Similar Demographics by Cognitive Disability
Demographics Similar to Costa Ricans by Cognitive Disability
In terms of cognitive disability, the demographic groups most similar to Costa Ricans are Immigrants from South Eastern Asia (17.0%, a difference of 0.050%), British (17.0%, a difference of 0.10%), Immigrants from Brazil (17.0%, a difference of 0.10%), Carpatho Rusyn (17.0%, a difference of 0.12%), and Scotch-Irish (17.1%, a difference of 0.13%).
| Demographics | Rating | Rank | Cognitive Disability |
| French | 90.0 /100 | #139 | Excellent 17.0% |
| Chileans | 89.9 /100 | #140 | Excellent 17.0% |
| Aleuts | 89.9 /100 | #141 | Excellent 17.0% |
| Carpatho Rusyns | 89.6 /100 | #142 | Excellent 17.0% |
| British | 89.3 /100 | #143 | Excellent 17.0% |
| Immigrants | Brazil | 89.3 /100 | #144 | Excellent 17.0% |
| Immigrants | South Eastern Asia | 88.7 /100 | #145 | Excellent 17.0% |
| Costa Ricans | 88.0 /100 | #146 | Excellent 17.0% |
| Scotch-Irish | 85.9 /100 | #147 | Excellent 17.1% |
| French Canadians | 85.7 /100 | #148 | Excellent 17.1% |
| Cypriots | 85.7 /100 | #149 | Excellent 17.1% |
| Basques | 85.5 /100 | #150 | Excellent 17.1% |
| Syrians | 83.0 /100 | #151 | Excellent 17.1% |
| Immigrants | Indonesia | 82.7 /100 | #152 | Excellent 17.1% |
| Immigrants | Kazakhstan | 80.5 /100 | #153 | Excellent 17.1% |
Demographics Similar to Immigrants from Senegal by Cognitive Disability
In terms of cognitive disability, the demographic groups most similar to Immigrants from Senegal are Indonesian (18.7%, a difference of 0.020%), U.S. Virgin Islander (18.7%, a difference of 0.040%), Dominican (18.7%, a difference of 0.10%), Kiowa (18.7%, a difference of 0.10%), and Pueblo (18.7%, a difference of 0.22%).
| Demographics | Rating | Rank | Cognitive Disability |
| Comanche | 0.0 /100 | #319 | Tragic 18.6% |
| Apache | 0.0 /100 | #320 | Tragic 18.6% |
| Africans | 0.0 /100 | #321 | Tragic 18.6% |
| Immigrants | Liberia | 0.0 /100 | #322 | Tragic 18.7% |
| Pueblo | 0.0 /100 | #323 | Tragic 18.7% |
| Dominicans | 0.0 /100 | #324 | Tragic 18.7% |
| Indonesians | 0.0 /100 | #325 | Tragic 18.7% |
| Immigrants | Senegal | 0.0 /100 | #326 | Tragic 18.7% |
| U.S. Virgin Islanders | 0.0 /100 | #327 | Tragic 18.7% |
| Kiowa | 0.0 /100 | #328 | Tragic 18.7% |
| Navajo | 0.0 /100 | #329 | Tragic 18.8% |
| Immigrants | Dominican Republic | 0.0 /100 | #330 | Tragic 18.8% |
| Pima | 0.0 /100 | #331 | Tragic 18.8% |
| Immigrants | Sudan | 0.0 /100 | #332 | Tragic 18.8% |
| Immigrants | Yemen | 0.0 /100 | #333 | Tragic 18.8% |