Immigrants from Fiji vs Immigrants from Senegal Cognitive Disability
COMPARE
Immigrants from Fiji
Immigrants from Senegal
Cognitive Disability
Cognitive Disability Comparison
Immigrants from Fiji
Immigrants from Senegal
17.4%
COGNITIVE DISABILITY
33.7/ 100
METRIC RATING
187th/ 347
METRIC RANK
18.7%
COGNITIVE DISABILITY
0.0/ 100
METRIC RATING
326th/ 347
METRIC RANK
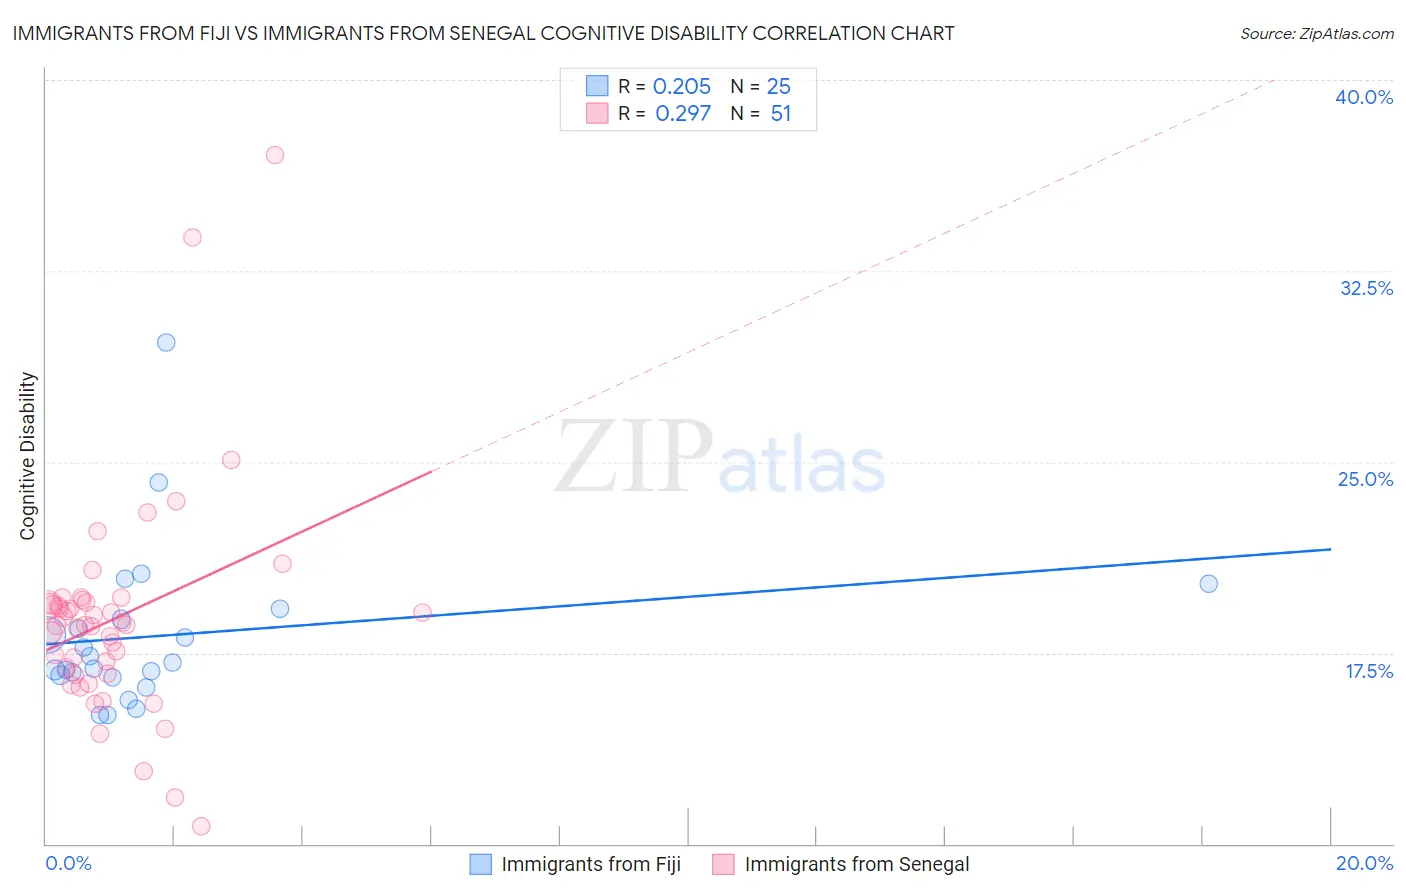
Immigrants from Fiji vs Immigrants from Senegal Cognitive Disability Correlation Chart
The statistical analysis conducted on geographies consisting of 93,755,380 people shows a weak positive correlation between the proportion of Immigrants from Fiji and percentage of population with cognitive disability in the United States with a correlation coefficient (R) of 0.205 and weighted average of 17.4%. Similarly, the statistical analysis conducted on geographies consisting of 90,129,295 people shows a weak positive correlation between the proportion of Immigrants from Senegal and percentage of population with cognitive disability in the United States with a correlation coefficient (R) of 0.297 and weighted average of 18.7%, a difference of 7.7%.
Cognitive Disability Correlation Summary
| Measurement | Immigrants from Fiji | Immigrants from Senegal |
| Minimum | 15.0% | 10.7% |
| Maximum | 29.7% | 37.0% |
| Range | 14.7% | 26.4% |
| Mean | 18.2% | 18.8% |
| Median | 17.1% | 18.6% |
| Interquartile 25% (IQ1) | 16.6% | 16.7% |
| Interquartile 75% (IQ3) | 19.0% | 19.5% |
| Interquartile Range (IQR) | 2.4% | 2.8% |
| Standard Deviation (Sample) | 3.2% | 4.3% |
| Standard Deviation (Population) | 3.1% | 4.3% |
Similar Demographics by Cognitive Disability
Demographics Similar to Immigrants from Fiji by Cognitive Disability
In terms of cognitive disability, the demographic groups most similar to Immigrants from Fiji are Cambodian (17.3%, a difference of 0.070%), Immigrants from France (17.4%, a difference of 0.13%), Afghan (17.3%, a difference of 0.14%), Immigrants from Western Asia (17.4%, a difference of 0.14%), and Crow (17.3%, a difference of 0.17%).
| Demographics | Rating | Rank | Cognitive Disability |
| Pakistanis | 43.9 /100 | #180 | Average 17.3% |
| Immigrants | Guyana | 42.9 /100 | #181 | Average 17.3% |
| Arabs | 42.8 /100 | #182 | Average 17.3% |
| Spaniards | 40.3 /100 | #183 | Average 17.3% |
| Crow | 39.1 /100 | #184 | Fair 17.3% |
| Afghans | 38.2 /100 | #185 | Fair 17.3% |
| Cambodians | 35.9 /100 | #186 | Fair 17.3% |
| Immigrants | Fiji | 33.7 /100 | #187 | Fair 17.4% |
| Immigrants | France | 29.8 /100 | #188 | Fair 17.4% |
| Immigrants | Western Asia | 29.5 /100 | #189 | Fair 17.4% |
| Immigrants | Spain | 27.7 /100 | #190 | Fair 17.4% |
| Immigrants | Nonimmigrants | 27.4 /100 | #191 | Fair 17.4% |
| Immigrants | Haiti | 27.1 /100 | #192 | Fair 17.4% |
| Delaware | 25.6 /100 | #193 | Fair 17.4% |
| Immigrants | Bosnia and Herzegovina | 22.0 /100 | #194 | Fair 17.4% |
Demographics Similar to Immigrants from Senegal by Cognitive Disability
In terms of cognitive disability, the demographic groups most similar to Immigrants from Senegal are Indonesian (18.7%, a difference of 0.020%), U.S. Virgin Islander (18.7%, a difference of 0.040%), Dominican (18.7%, a difference of 0.10%), Kiowa (18.7%, a difference of 0.10%), and Pueblo (18.7%, a difference of 0.22%).
| Demographics | Rating | Rank | Cognitive Disability |
| Comanche | 0.0 /100 | #319 | Tragic 18.6% |
| Apache | 0.0 /100 | #320 | Tragic 18.6% |
| Africans | 0.0 /100 | #321 | Tragic 18.6% |
| Immigrants | Liberia | 0.0 /100 | #322 | Tragic 18.7% |
| Pueblo | 0.0 /100 | #323 | Tragic 18.7% |
| Dominicans | 0.0 /100 | #324 | Tragic 18.7% |
| Indonesians | 0.0 /100 | #325 | Tragic 18.7% |
| Immigrants | Senegal | 0.0 /100 | #326 | Tragic 18.7% |
| U.S. Virgin Islanders | 0.0 /100 | #327 | Tragic 18.7% |
| Kiowa | 0.0 /100 | #328 | Tragic 18.7% |
| Navajo | 0.0 /100 | #329 | Tragic 18.8% |
| Immigrants | Dominican Republic | 0.0 /100 | #330 | Tragic 18.8% |
| Pima | 0.0 /100 | #331 | Tragic 18.8% |
| Immigrants | Sudan | 0.0 /100 | #332 | Tragic 18.8% |
| Immigrants | Yemen | 0.0 /100 | #333 | Tragic 18.8% |