Honduran vs Zimbabwean Disability Age Under 5
COMPARE
Honduran
Zimbabwean
Disability Age Under 5
Disability Age Under 5 Comparison
Hondurans
Zimbabweans
1.2%
DISABILITY AGE UNDER 5
72.5/ 100
METRIC RATING
152nd/ 347
METRIC RANK
1.2%
DISABILITY AGE UNDER 5
90.6/ 100
METRIC RATING
123rd/ 347
METRIC RANK
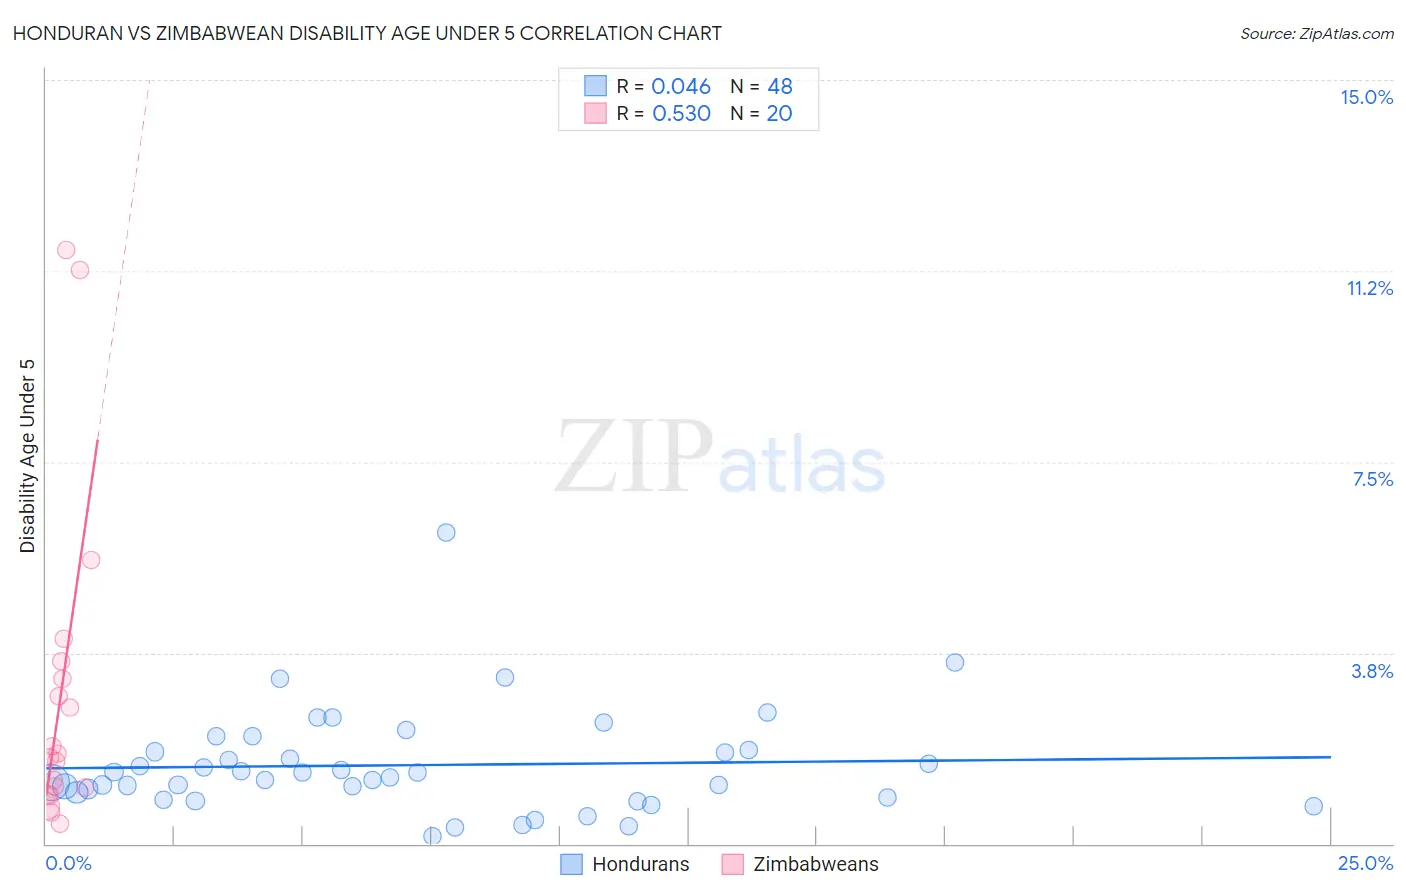
Honduran vs Zimbabwean Disability Age Under 5 Correlation Chart
The statistical analysis conducted on geographies consisting of 207,586,632 people shows no correlation between the proportion of Hondurans and percentage of population with a disability under the age of 5 in the United States with a correlation coefficient (R) of 0.046 and weighted average of 1.2%. Similarly, the statistical analysis conducted on geographies consisting of 56,916,571 people shows a substantial positive correlation between the proportion of Zimbabweans and percentage of population with a disability under the age of 5 in the United States with a correlation coefficient (R) of 0.530 and weighted average of 1.2%, a difference of 3.1%.
Disability Age Under 5 Correlation Summary
| Measurement | Honduran | Zimbabwean |
| Minimum | 0.16% | 0.39% |
| Maximum | 6.1% | 11.7% |
| Range | 6.0% | 11.3% |
| Mean | 1.5% | 3.0% |
| Median | 1.4% | 1.7% |
| Interquartile 25% (IQ1) | 0.96% | 1.0% |
| Interquartile 75% (IQ3) | 1.8% | 3.4% |
| Interquartile Range (IQR) | 0.86% | 2.4% |
| Standard Deviation (Sample) | 1.0% | 3.2% |
| Standard Deviation (Population) | 1.0% | 3.1% |
Similar Demographics by Disability Age Under 5
Demographics Similar to Hondurans by Disability Age Under 5
In terms of disability age under 5, the demographic groups most similar to Hondurans are Yaqui (1.2%, a difference of 0.28%), Immigrants from Thailand (1.2%, a difference of 0.34%), South American (1.2%, a difference of 0.38%), Uruguayan (1.2%, a difference of 0.41%), and Kenyan (1.2%, a difference of 0.42%).
| Demographics | Rating | Rank | Disability Age Under 5 |
| Immigrants | Zimbabwe | 77.9 /100 | #145 | Good 1.2% |
| Samoans | 77.7 /100 | #146 | Good 1.2% |
| Icelanders | 76.3 /100 | #147 | Good 1.2% |
| Ghanaians | 76.3 /100 | #148 | Good 1.2% |
| Kenyans | 75.9 /100 | #149 | Good 1.2% |
| South Americans | 75.6 /100 | #150 | Good 1.2% |
| Yaqui | 74.8 /100 | #151 | Good 1.2% |
| Hondurans | 72.5 /100 | #152 | Good 1.2% |
| Immigrants | Thailand | 69.4 /100 | #153 | Good 1.2% |
| Uruguayans | 68.8 /100 | #154 | Good 1.2% |
| Immigrants | Ghana | 68.7 /100 | #155 | Good 1.2% |
| Hawaiians | 68.5 /100 | #156 | Good 1.2% |
| Immigrants | South America | 67.0 /100 | #157 | Good 1.2% |
| Arabs | 66.4 /100 | #158 | Good 1.2% |
| Colombians | 65.8 /100 | #159 | Good 1.2% |
Demographics Similar to Zimbabweans by Disability Age Under 5
In terms of disability age under 5, the demographic groups most similar to Zimbabweans are Immigrants from Cambodia (1.2%, a difference of 0.020%), Aleut (1.2%, a difference of 0.050%), Japanese (1.2%, a difference of 0.080%), Immigrants from Senegal (1.2%, a difference of 0.24%), and Central American (1.2%, a difference of 0.25%).
| Demographics | Rating | Rank | Disability Age Under 5 |
| Immigrants | Northern Africa | 93.8 /100 | #116 | Exceptional 1.2% |
| Immigrants | Philippines | 93.5 /100 | #117 | Exceptional 1.2% |
| Immigrants | Venezuela | 93.4 /100 | #118 | Exceptional 1.2% |
| Bhutanese | 92.5 /100 | #119 | Exceptional 1.2% |
| Immigrants | Eritrea | 92.3 /100 | #120 | Exceptional 1.2% |
| Immigrants | Senegal | 91.4 /100 | #121 | Exceptional 1.2% |
| Aleuts | 90.7 /100 | #122 | Exceptional 1.2% |
| Zimbabweans | 90.6 /100 | #123 | Exceptional 1.2% |
| Immigrants | Cambodia | 90.5 /100 | #124 | Exceptional 1.2% |
| Japanese | 90.3 /100 | #125 | Exceptional 1.2% |
| Central Americans | 89.7 /100 | #126 | Excellent 1.2% |
| Immigrants | Romania | 88.4 /100 | #127 | Excellent 1.2% |
| Immigrants | France | 88.4 /100 | #128 | Excellent 1.2% |
| Immigrants | Immigrants | 88.0 /100 | #129 | Excellent 1.2% |
| Koreans | 87.7 /100 | #130 | Excellent 1.2% |