Honduran vs Immigrants from Asia In Labor Force | Age 20-24
COMPARE
Honduran
Immigrants from Asia
In Labor Force | Age 20-24
In Labor Force | Age 20-24 Comparison
Hondurans
Immigrants from Asia
74.8%
IN LABOR FORCE | AGE 20-24
32.7/ 100
METRIC RATING
188th/ 347
METRIC RANK
73.6%
IN LABOR FORCE | AGE 20-24
0.5/ 100
METRIC RATING
263rd/ 347
METRIC RANK
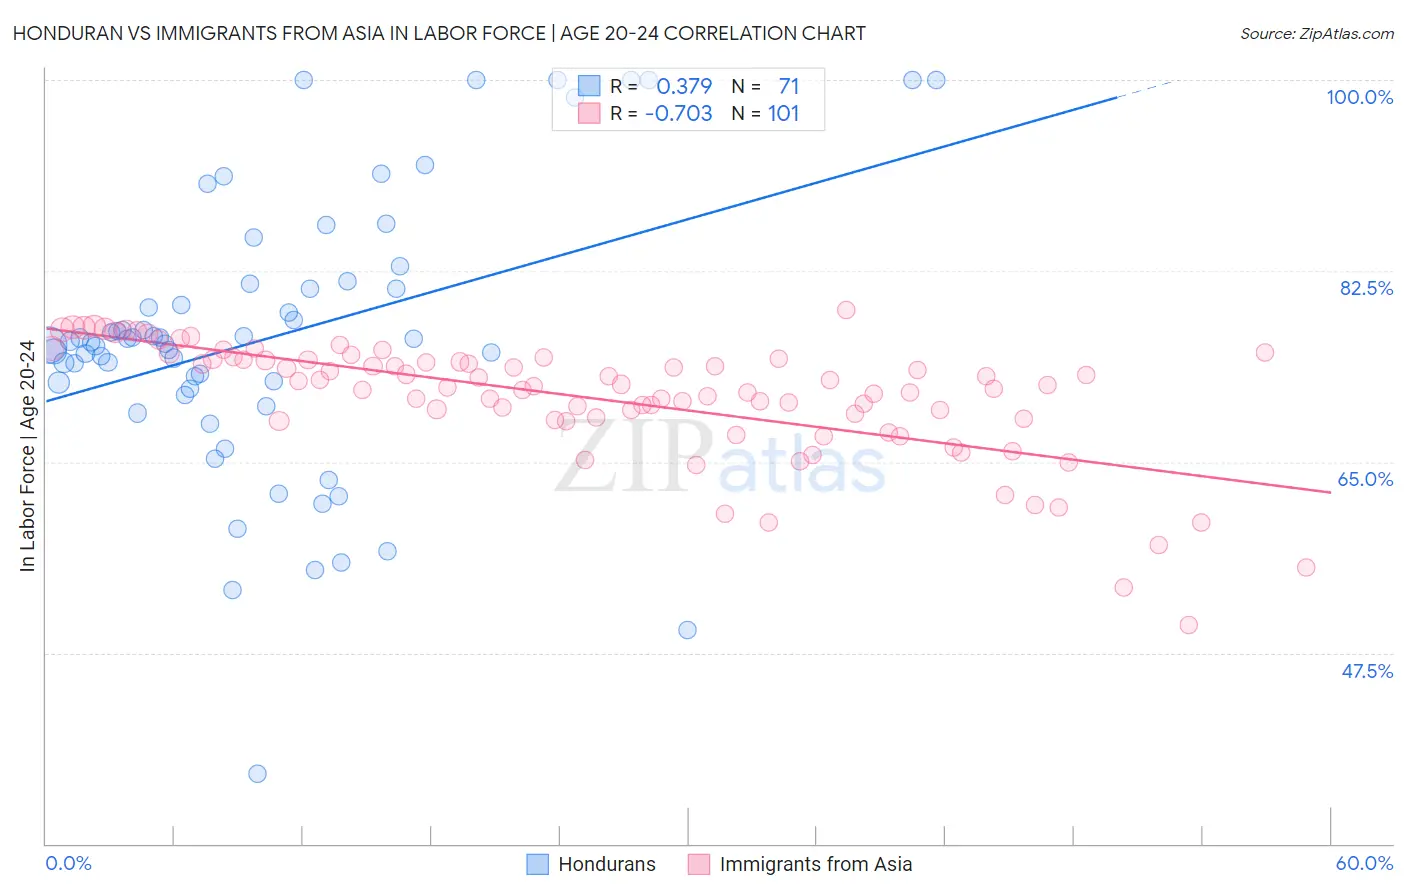
Honduran vs Immigrants from Asia In Labor Force | Age 20-24 Correlation Chart
The statistical analysis conducted on geographies consisting of 357,783,133 people shows a mild positive correlation between the proportion of Hondurans and labor force participation rate among population between the ages 20 and 24 in the United States with a correlation coefficient (R) of 0.379 and weighted average of 74.8%. Similarly, the statistical analysis conducted on geographies consisting of 548,419,832 people shows a strong negative correlation between the proportion of Immigrants from Asia and labor force participation rate among population between the ages 20 and 24 in the United States with a correlation coefficient (R) of -0.703 and weighted average of 73.6%, a difference of 1.7%.
In Labor Force | Age 20-24 Correlation Summary
| Measurement | Honduran | Immigrants from Asia |
| Minimum | 36.4% | 50.0% |
| Maximum | 100.0% | 78.9% |
| Range | 63.6% | 28.9% |
| Mean | 76.4% | 70.8% |
| Median | 76.1% | 72.0% |
| Interquartile 25% (IQ1) | 71.8% | 68.9% |
| Interquartile 75% (IQ3) | 81.3% | 74.4% |
| Interquartile Range (IQR) | 9.5% | 5.5% |
| Standard Deviation (Sample) | 12.8% | 5.5% |
| Standard Deviation (Population) | 12.7% | 5.5% |
Similar Demographics by In Labor Force | Age 20-24
Demographics Similar to Hondurans by In Labor Force | Age 20-24
In terms of in labor force | age 20-24, the demographic groups most similar to Hondurans are Immigrants from Northern Europe (74.8%, a difference of 0.0%), Immigrants from Honduras (74.9%, a difference of 0.010%), Russian (74.8%, a difference of 0.010%), Immigrants from Eastern Europe (74.9%, a difference of 0.020%), and Immigrants from Hungary (74.9%, a difference of 0.040%).
| Demographics | Rating | Rank | In Labor Force | Age 20-24 |
| Africans | 42.5 /100 | #181 | Average 75.0% |
| Immigrants | South Africa | 36.9 /100 | #182 | Fair 74.9% |
| Immigrants | Costa Rica | 36.7 /100 | #183 | Fair 74.9% |
| Immigrants | Hungary | 35.0 /100 | #184 | Fair 74.9% |
| Sri Lankans | 34.9 /100 | #185 | Fair 74.9% |
| Immigrants | Eastern Europe | 33.8 /100 | #186 | Fair 74.9% |
| Immigrants | Honduras | 33.5 /100 | #187 | Fair 74.9% |
| Hondurans | 32.7 /100 | #188 | Fair 74.8% |
| Immigrants | Northern Europe | 32.6 /100 | #189 | Fair 74.8% |
| Russians | 32.2 /100 | #190 | Fair 74.8% |
| Senegalese | 28.1 /100 | #191 | Fair 74.8% |
| Immigrants | Europe | 27.5 /100 | #192 | Fair 74.8% |
| Alsatians | 27.1 /100 | #193 | Fair 74.8% |
| Immigrants | Denmark | 25.8 /100 | #194 | Fair 74.8% |
| Eastern Europeans | 25.4 /100 | #195 | Fair 74.8% |
Demographics Similar to Immigrants from Asia by In Labor Force | Age 20-24
In terms of in labor force | age 20-24, the demographic groups most similar to Immigrants from Asia are Immigrants from Haiti (73.6%, a difference of 0.010%), Burmese (73.6%, a difference of 0.020%), Haitian (73.6%, a difference of 0.030%), Immigrants from Western Asia (73.5%, a difference of 0.070%), and Asian (73.7%, a difference of 0.080%).
| Demographics | Rating | Rank | In Labor Force | Age 20-24 |
| Spanish American Indians | 0.8 /100 | #256 | Tragic 73.7% |
| Paraguayans | 0.8 /100 | #257 | Tragic 73.7% |
| Egyptians | 0.7 /100 | #258 | Tragic 73.7% |
| Dutch West Indians | 0.7 /100 | #259 | Tragic 73.7% |
| Immigrants | Turkey | 0.7 /100 | #260 | Tragic 73.7% |
| Houma | 0.6 /100 | #261 | Tragic 73.7% |
| Asians | 0.6 /100 | #262 | Tragic 73.7% |
| Immigrants | Asia | 0.5 /100 | #263 | Tragic 73.6% |
| Immigrants | Haiti | 0.5 /100 | #264 | Tragic 73.6% |
| Burmese | 0.5 /100 | #265 | Tragic 73.6% |
| Haitians | 0.5 /100 | #266 | Tragic 73.6% |
| Immigrants | Western Asia | 0.4 /100 | #267 | Tragic 73.5% |
| South Americans | 0.4 /100 | #268 | Tragic 73.5% |
| Colombians | 0.3 /100 | #269 | Tragic 73.5% |
| Immigrants | Russia | 0.3 /100 | #270 | Tragic 73.5% |