Tsimshian vs Spanish American Disability Age Under 5
COMPARE
Tsimshian
Spanish American
Disability Age Under 5
Disability Age Under 5 Comparison
Tsimshian
Spanish Americans
2.4%
DISABILITY AGE UNDER 5
0.0/ 100
METRIC RATING
341st/ 347
METRIC RANK
1.1%
DISABILITY AGE UNDER 5
96.9/ 100
METRIC RATING
93rd/ 347
METRIC RANK
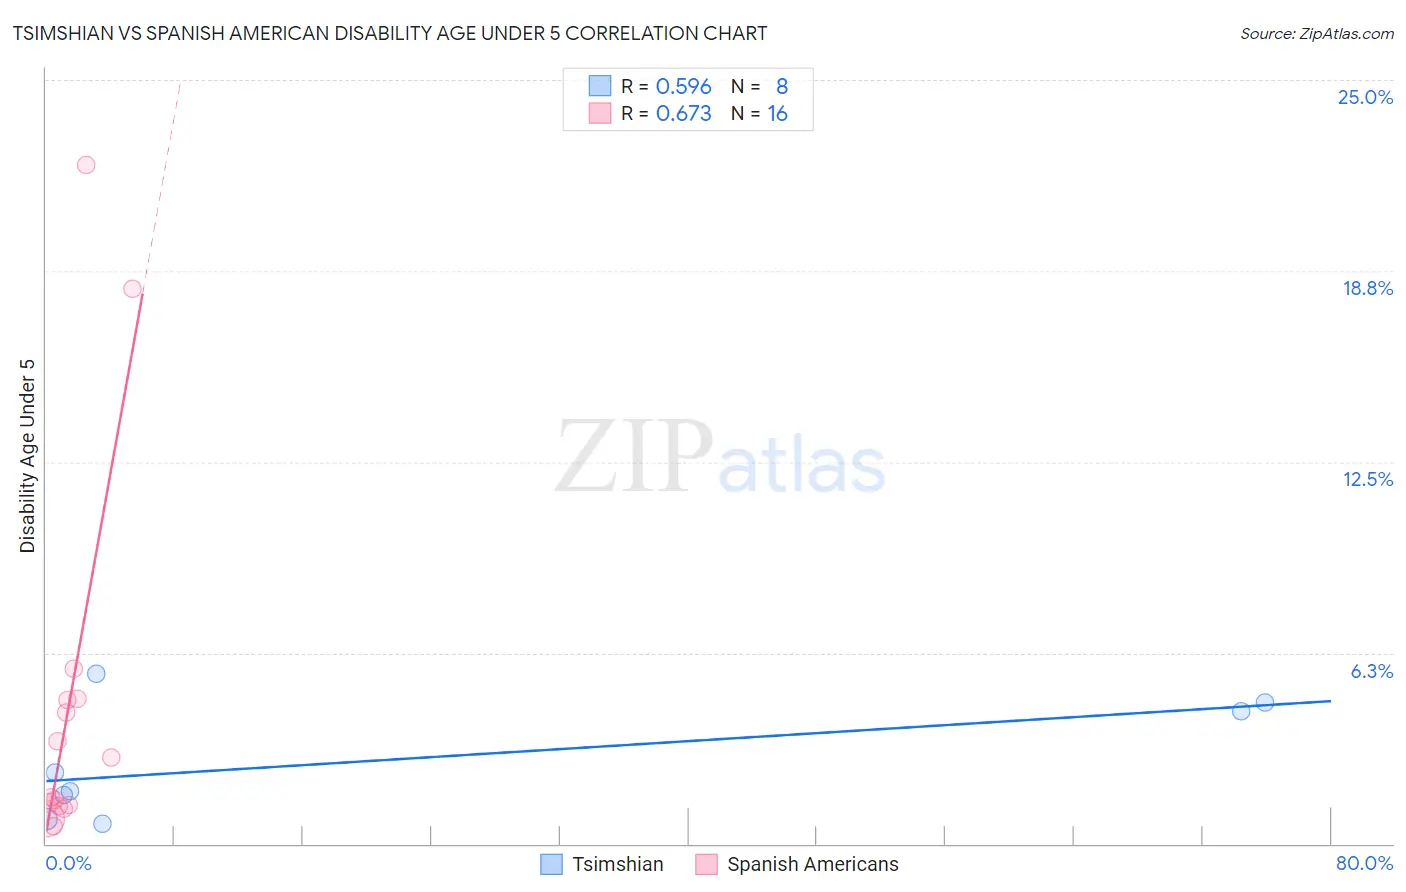
Tsimshian vs Spanish American Disability Age Under 5 Correlation Chart
The statistical analysis conducted on geographies consisting of 13,579,773 people shows a substantial positive correlation between the proportion of Tsimshian and percentage of population with a disability under the age of 5 in the United States with a correlation coefficient (R) of 0.596 and weighted average of 2.4%. Similarly, the statistical analysis conducted on geographies consisting of 83,596,230 people shows a significant positive correlation between the proportion of Spanish Americans and percentage of population with a disability under the age of 5 in the United States with a correlation coefficient (R) of 0.673 and weighted average of 1.1%, a difference of 110.7%.
Disability Age Under 5 Correlation Summary
| Measurement | Tsimshian | Spanish American |
| Minimum | 0.66% | 0.56% |
| Maximum | 5.6% | 22.2% |
| Range | 4.9% | 21.7% |
| Mean | 2.7% | 4.7% |
| Median | 2.0% | 2.2% |
| Interquartile 25% (IQ1) | 1.2% | 1.3% |
| Interquartile 75% (IQ3) | 4.5% | 4.7% |
| Interquartile Range (IQR) | 3.3% | 3.5% |
| Standard Deviation (Sample) | 1.9% | 6.3% |
| Standard Deviation (Population) | 1.8% | 6.1% |
Similar Demographics by Disability Age Under 5
Demographics Similar to Tsimshian by Disability Age Under 5
In terms of disability age under 5, the demographic groups most similar to Tsimshian are Menominee (2.3%, a difference of 4.9%), Immigrants from the Azores (2.2%, a difference of 7.8%), Tohono O'odham (2.2%, a difference of 10.2%), Apache (2.0%, a difference of 18.5%), and Paraguayan (2.0%, a difference of 22.0%).
| Demographics | Rating | Rank | Disability Age Under 5 |
| Dutch West Indians | 0.0 /100 | #333 | Tragic 1.9% |
| Natives/Alaskans | 0.0 /100 | #334 | Tragic 1.9% |
| Pennsylvania Germans | 0.0 /100 | #335 | Tragic 1.9% |
| Paraguayans | 0.0 /100 | #336 | Tragic 2.0% |
| Apache | 0.0 /100 | #337 | Tragic 2.0% |
| Tohono O'odham | 0.0 /100 | #338 | Tragic 2.2% |
| Immigrants | Azores | 0.0 /100 | #339 | Tragic 2.2% |
| Menominee | 0.0 /100 | #340 | Tragic 2.3% |
| Tsimshian | 0.0 /100 | #341 | Tragic 2.4% |
| Alaska Natives | 0.0 /100 | #342 | Tragic 2.9% |
| Colville | 0.0 /100 | #343 | Tragic 3.3% |
| Inupiat | 0.0 /100 | #344 | Tragic 3.7% |
| Paiute | 0.0 /100 | #345 | Tragic 3.9% |
| Yup'ik | 0.0 /100 | #346 | Tragic 4.5% |
| Hopi | 0.0 /100 | #347 | Tragic 4.6% |
Demographics Similar to Spanish Americans by Disability Age Under 5
In terms of disability age under 5, the demographic groups most similar to Spanish Americans are Immigrants from Cuba (1.1%, a difference of 0.030%), Sri Lankan (1.1%, a difference of 0.060%), Immigrants from Moldova (1.1%, a difference of 0.11%), Albanian (1.1%, a difference of 0.20%), and Mongolian (1.1%, a difference of 0.22%).
| Demographics | Rating | Rank | Disability Age Under 5 |
| Okinawans | 97.6 /100 | #86 | Exceptional 1.1% |
| Ugandans | 97.5 /100 | #87 | Exceptional 1.1% |
| Immigrants | Dominican Republic | 97.5 /100 | #88 | Exceptional 1.1% |
| Ethiopians | 97.2 /100 | #89 | Exceptional 1.1% |
| Chinese | 97.2 /100 | #90 | Exceptional 1.1% |
| Albanians | 97.2 /100 | #91 | Exceptional 1.1% |
| Immigrants | Cuba | 97.0 /100 | #92 | Exceptional 1.1% |
| Spanish Americans | 96.9 /100 | #93 | Exceptional 1.1% |
| Sri Lankans | 96.8 /100 | #94 | Exceptional 1.1% |
| Immigrants | Moldova | 96.8 /100 | #95 | Exceptional 1.1% |
| Mongolians | 96.6 /100 | #96 | Exceptional 1.1% |
| Immigrants | Iraq | 96.5 /100 | #97 | Exceptional 1.1% |
| Immigrants | South Eastern Asia | 96.5 /100 | #98 | Exceptional 1.1% |
| Dominicans | 96.3 /100 | #99 | Exceptional 1.1% |
| Nicaraguans | 96.3 /100 | #100 | Exceptional 1.1% |