Hispanic or Latino vs Immigrants from Peru Disability Age Under 5
COMPARE
Hispanic or Latino
Immigrants from Peru
Disability Age Under 5
Disability Age Under 5 Comparison
Hispanics or Latinos
Immigrants from Peru
1.3%
DISABILITY AGE UNDER 5
7.7/ 100
METRIC RATING
223rd/ 347
METRIC RANK
1.2%
DISABILITY AGE UNDER 5
43.7/ 100
METRIC RATING
181st/ 347
METRIC RANK
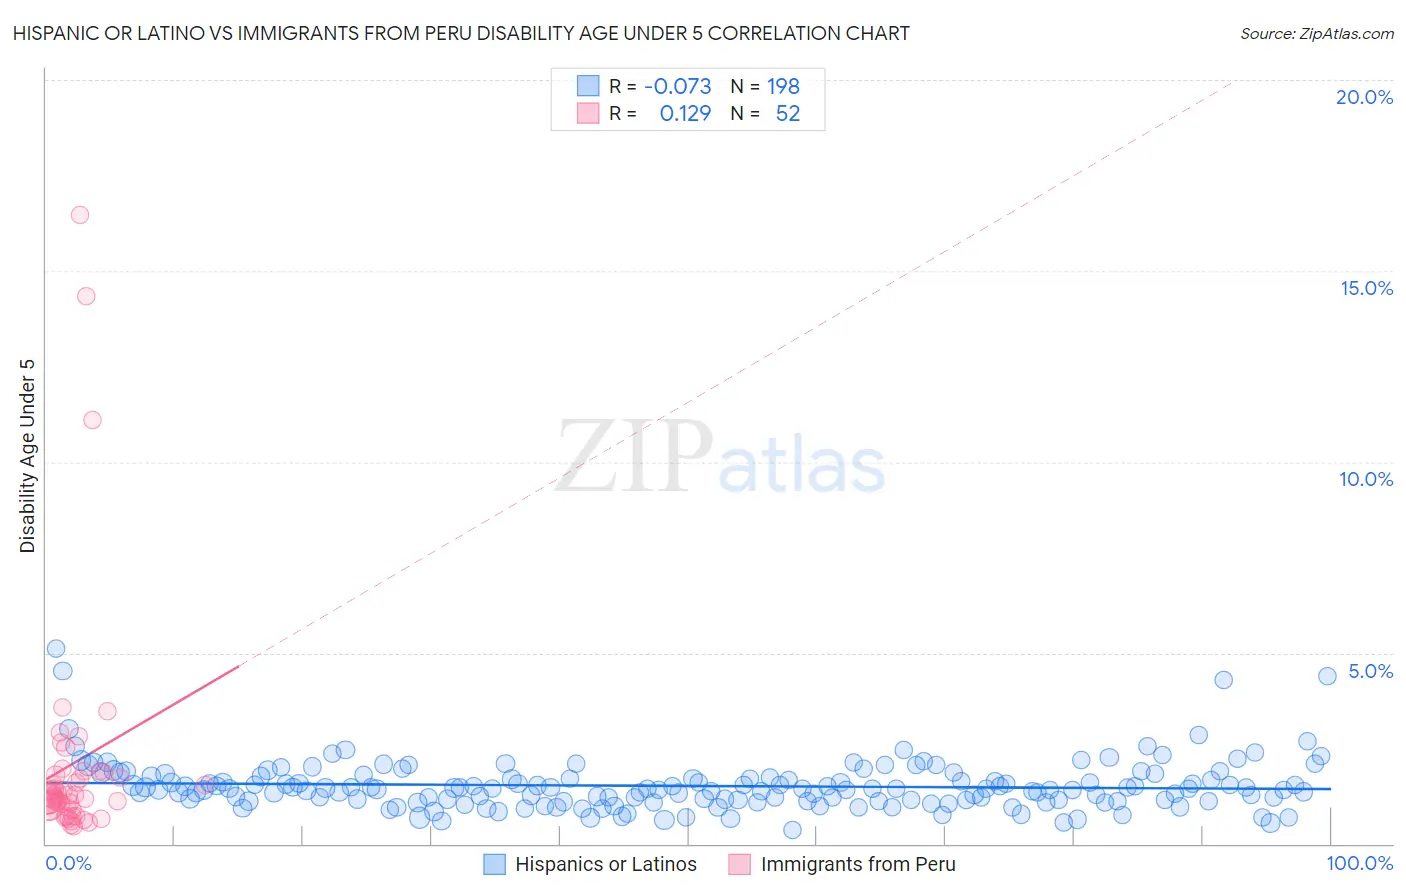
Hispanic or Latino vs Immigrants from Peru Disability Age Under 5 Correlation Chart
The statistical analysis conducted on geographies consisting of 261,565,458 people shows a slight negative correlation between the proportion of Hispanics or Latinos and percentage of population with a disability under the age of 5 in the United States with a correlation coefficient (R) of -0.073 and weighted average of 1.3%. Similarly, the statistical analysis conducted on geographies consisting of 191,283,198 people shows a poor positive correlation between the proportion of Immigrants from Peru and percentage of population with a disability under the age of 5 in the United States with a correlation coefficient (R) of 0.129 and weighted average of 1.2%, a difference of 5.0%.
Disability Age Under 5 Correlation Summary
| Measurement | Hispanic or Latino | Immigrants from Peru |
| Minimum | 0.35% | 0.47% |
| Maximum | 5.1% | 16.5% |
| Range | 4.8% | 16.0% |
| Mean | 1.5% | 2.1% |
| Median | 1.4% | 1.2% |
| Interquartile 25% (IQ1) | 1.1% | 0.92% |
| Interquartile 75% (IQ3) | 1.7% | 1.8% |
| Interquartile Range (IQR) | 0.61% | 0.90% |
| Standard Deviation (Sample) | 0.65% | 3.1% |
| Standard Deviation (Population) | 0.65% | 3.1% |
Similar Demographics by Disability Age Under 5
Demographics Similar to Hispanics or Latinos by Disability Age Under 5
In terms of disability age under 5, the demographic groups most similar to Hispanics or Latinos are Latvian (1.3%, a difference of 0.16%), Subsaharan African (1.3%, a difference of 0.19%), Ukrainian (1.3%, a difference of 0.19%), Panamanian (1.3%, a difference of 0.19%), and Bahamian (1.3%, a difference of 0.19%).
| Demographics | Rating | Rank | Disability Age Under 5 |
| Bangladeshis | 15.5 /100 | #216 | Poor 1.3% |
| Cypriots | 14.9 /100 | #217 | Poor 1.3% |
| Malaysians | 13.2 /100 | #218 | Poor 1.3% |
| Immigrants | Croatia | 11.2 /100 | #219 | Poor 1.3% |
| Serbians | 9.6 /100 | #220 | Tragic 1.3% |
| Sub-Saharan Africans | 8.3 /100 | #221 | Tragic 1.3% |
| Ukrainians | 8.3 /100 | #222 | Tragic 1.3% |
| Hispanics or Latinos | 7.7 /100 | #223 | Tragic 1.3% |
| Latvians | 7.1 /100 | #224 | Tragic 1.3% |
| Panamanians | 7.1 /100 | #225 | Tragic 1.3% |
| Bahamians | 7.1 /100 | #226 | Tragic 1.3% |
| Taiwanese | 6.1 /100 | #227 | Tragic 1.3% |
| Luxembourgers | 6.1 /100 | #228 | Tragic 1.3% |
| Immigrants | Costa Rica | 5.5 /100 | #229 | Tragic 1.3% |
| Lebanese | 5.3 /100 | #230 | Tragic 1.3% |
Demographics Similar to Immigrants from Peru by Disability Age Under 5
In terms of disability age under 5, the demographic groups most similar to Immigrants from Peru are Macedonian (1.2%, a difference of 0.0%), Immigrants from Saudi Arabia (1.2%, a difference of 0.040%), Palestinian (1.2%, a difference of 0.060%), Immigrants from Mexico (1.2%, a difference of 0.070%), and Immigrants from Western Africa (1.2%, a difference of 0.11%).
| Demographics | Rating | Rank | Disability Age Under 5 |
| Immigrants | Latvia | 50.0 /100 | #174 | Average 1.2% |
| Immigrants | Nigeria | 50.0 /100 | #175 | Average 1.2% |
| Immigrants | Kenya | 48.6 /100 | #176 | Average 1.2% |
| Comanche | 47.5 /100 | #177 | Average 1.2% |
| Venezuelans | 47.1 /100 | #178 | Average 1.2% |
| Immigrants | Bahamas | 45.2 /100 | #179 | Average 1.2% |
| Immigrants | Mexico | 44.4 /100 | #180 | Average 1.2% |
| Immigrants | Peru | 43.7 /100 | #181 | Average 1.2% |
| Macedonians | 43.7 /100 | #181 | Average 1.2% |
| Immigrants | Saudi Arabia | 43.3 /100 | #183 | Average 1.2% |
| Palestinians | 43.0 /100 | #184 | Average 1.2% |
| Immigrants | Western Africa | 42.5 /100 | #185 | Average 1.2% |
| Cubans | 42.5 /100 | #186 | Average 1.2% |
| Immigrants | Haiti | 40.2 /100 | #187 | Average 1.3% |
| Haitians | 39.9 /100 | #188 | Fair 1.3% |