Immigrants from Eastern Europe vs Immigrants from Venezuela Female Disability
COMPARE
Immigrants from Eastern Europe
Immigrants from Venezuela
Female Disability
Female Disability Comparison
Immigrants from Eastern Europe
Immigrants from Venezuela
11.8%
FEMALE DISABILITY
97.2/ 100
METRIC RATING
117th/ 347
METRIC RANK
10.9%
FEMALE DISABILITY
100.0/ 100
METRIC RATING
19th/ 347
METRIC RANK
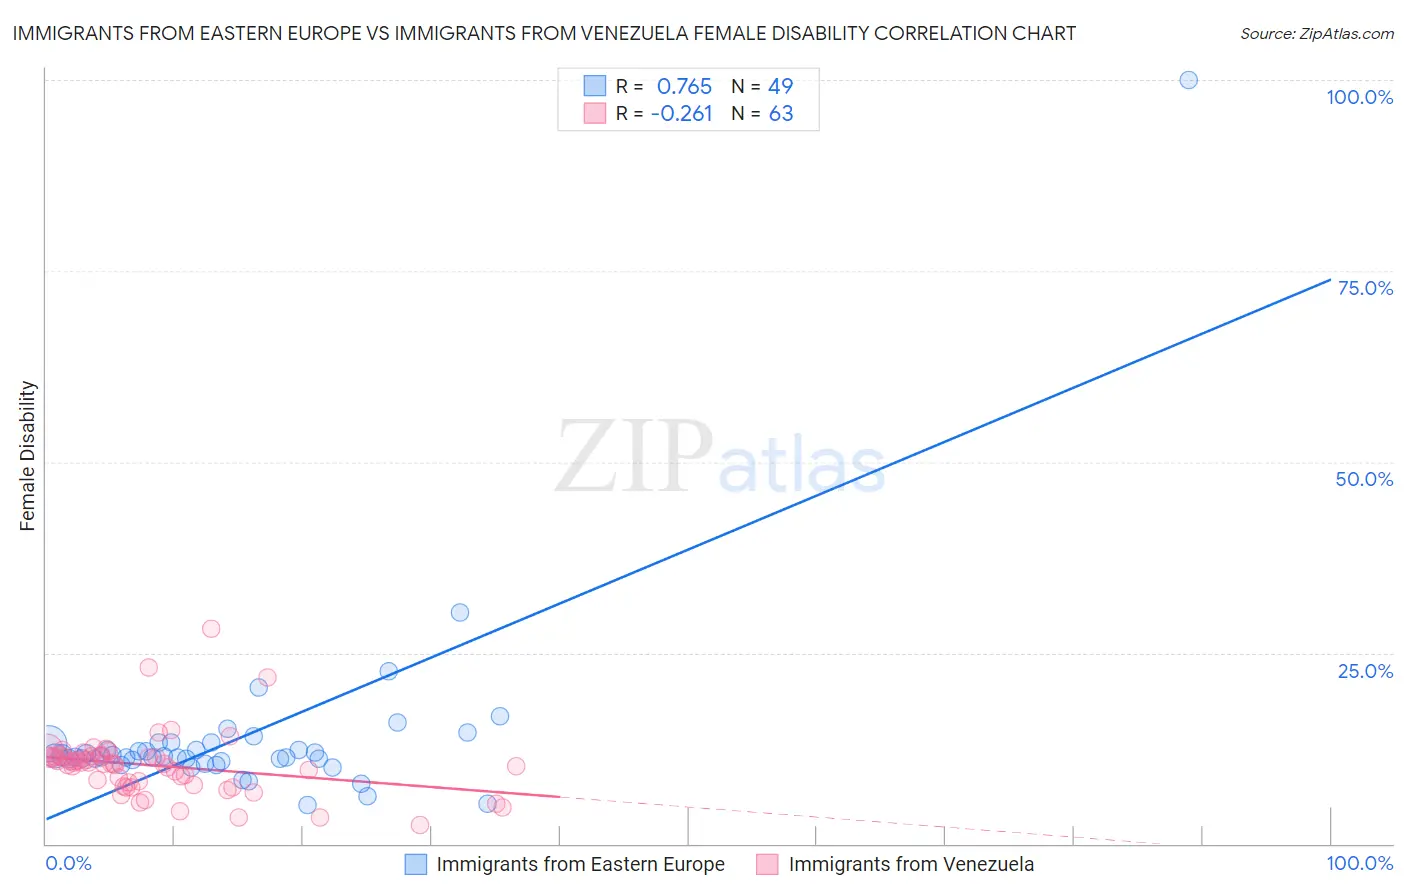
Immigrants from Eastern Europe vs Immigrants from Venezuela Female Disability Correlation Chart
The statistical analysis conducted on geographies consisting of 475,778,439 people shows a strong positive correlation between the proportion of Immigrants from Eastern Europe and percentage of females with a disability in the United States with a correlation coefficient (R) of 0.765 and weighted average of 11.8%. Similarly, the statistical analysis conducted on geographies consisting of 287,842,421 people shows a weak negative correlation between the proportion of Immigrants from Venezuela and percentage of females with a disability in the United States with a correlation coefficient (R) of -0.261 and weighted average of 10.9%, a difference of 8.6%.
Female Disability Correlation Summary
| Measurement | Immigrants from Eastern Europe | Immigrants from Venezuela |
| Minimum | 5.1% | 2.5% |
| Maximum | 100.0% | 28.1% |
| Range | 94.9% | 25.6% |
| Mean | 13.9% | 10.2% |
| Median | 11.4% | 10.5% |
| Interquartile 25% (IQ1) | 10.9% | 7.7% |
| Interquartile 75% (IQ3) | 13.2% | 11.4% |
| Interquartile Range (IQR) | 2.3% | 3.7% |
| Standard Deviation (Sample) | 13.2% | 4.2% |
| Standard Deviation (Population) | 13.1% | 4.2% |
Similar Demographics by Female Disability
Demographics Similar to Immigrants from Eastern Europe by Female Disability
In terms of female disability, the demographic groups most similar to Immigrants from Eastern Europe are Immigrants from Nigeria (11.8%, a difference of 0.0%), Immigrants from Uganda (11.8%, a difference of 0.010%), Immigrants from Kazakhstan (11.8%, a difference of 0.090%), Immigrants from Netherlands (11.8%, a difference of 0.11%), and Immigrants from North Macedonia (11.8%, a difference of 0.12%).
| Demographics | Rating | Rank | Female Disability |
| Soviet Union | 98.1 /100 | #110 | Exceptional 11.7% |
| Costa Ricans | 98.1 /100 | #111 | Exceptional 11.7% |
| Immigrants | Bangladesh | 97.8 /100 | #112 | Exceptional 11.8% |
| Immigrants | Belarus | 97.8 /100 | #113 | Exceptional 11.8% |
| South Africans | 97.7 /100 | #114 | Exceptional 11.8% |
| Brazilians | 97.7 /100 | #115 | Exceptional 11.8% |
| Immigrants | Morocco | 97.6 /100 | #116 | Exceptional 11.8% |
| Immigrants | Eastern Europe | 97.2 /100 | #117 | Exceptional 11.8% |
| Immigrants | Nigeria | 97.2 /100 | #118 | Exceptional 11.8% |
| Immigrants | Uganda | 97.2 /100 | #119 | Exceptional 11.8% |
| Immigrants | Kazakhstan | 97.0 /100 | #120 | Exceptional 11.8% |
| Immigrants | Netherlands | 96.9 /100 | #121 | Exceptional 11.8% |
| Immigrants | North Macedonia | 96.8 /100 | #122 | Exceptional 11.8% |
| Immigrants | Croatia | 96.7 /100 | #123 | Exceptional 11.8% |
| Russians | 96.5 /100 | #124 | Exceptional 11.8% |
Demographics Similar to Immigrants from Venezuela by Female Disability
In terms of female disability, the demographic groups most similar to Immigrants from Venezuela are Immigrants from Pakistan (10.9%, a difference of 0.17%), Immigrants from Iran (10.8%, a difference of 0.21%), Asian (10.9%, a difference of 0.54%), Indian (Asian) (10.8%, a difference of 0.60%), and Immigrants from Sri Lanka (10.9%, a difference of 0.66%).
| Demographics | Rating | Rank | Female Disability |
| Immigrants | Israel | 100.0 /100 | #12 | Exceptional 10.7% |
| Immigrants | Eastern Asia | 100.0 /100 | #13 | Exceptional 10.7% |
| Immigrants | China | 100.0 /100 | #14 | Exceptional 10.7% |
| Burmese | 100.0 /100 | #15 | Exceptional 10.7% |
| Okinawans | 100.0 /100 | #16 | Exceptional 10.8% |
| Indians (Asian) | 100.0 /100 | #17 | Exceptional 10.8% |
| Immigrants | Iran | 100.0 /100 | #18 | Exceptional 10.8% |
| Immigrants | Venezuela | 100.0 /100 | #19 | Exceptional 10.9% |
| Immigrants | Pakistan | 100.0 /100 | #20 | Exceptional 10.9% |
| Asians | 100.0 /100 | #21 | Exceptional 10.9% |
| Immigrants | Sri Lanka | 100.0 /100 | #22 | Exceptional 10.9% |
| Venezuelans | 100.0 /100 | #23 | Exceptional 11.0% |
| Immigrants | Argentina | 100.0 /100 | #24 | Exceptional 11.0% |
| Immigrants | Asia | 100.0 /100 | #25 | Exceptional 11.0% |
| Argentineans | 100.0 /100 | #26 | Exceptional 11.0% |