Hispanic or Latino vs Paraguayan Female Disability
COMPARE
Hispanic or Latino
Paraguayan
Female Disability
Female Disability Comparison
Hispanics or Latinos
Paraguayans
12.5%
FEMALE DISABILITY
8.0/ 100
METRIC RATING
226th/ 347
METRIC RANK
11.2%
FEMALE DISABILITY
100.0/ 100
METRIC RATING
41st/ 347
METRIC RANK
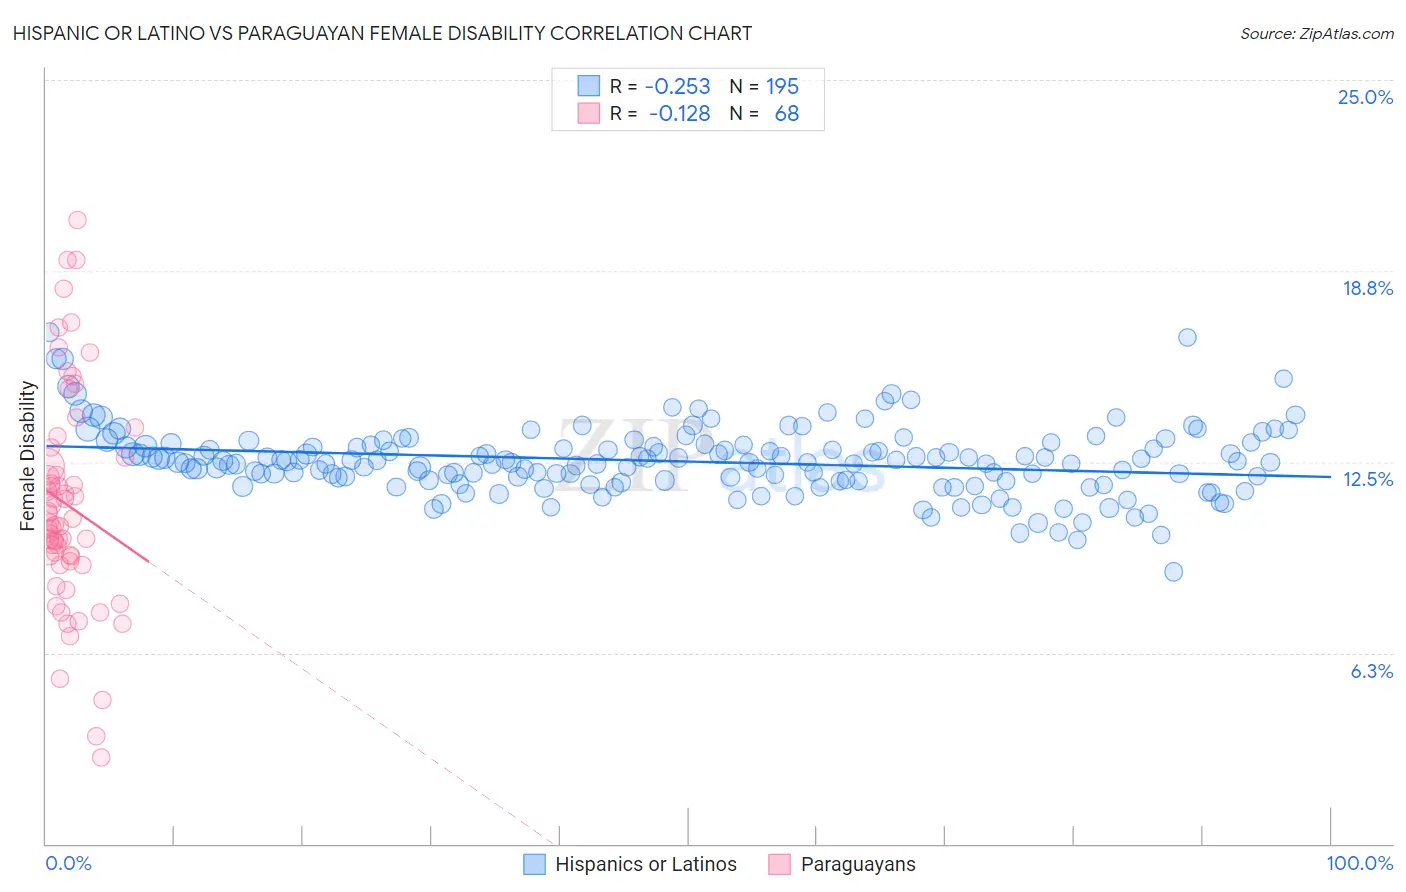
Hispanic or Latino vs Paraguayan Female Disability Correlation Chart
The statistical analysis conducted on geographies consisting of 572,741,012 people shows a weak negative correlation between the proportion of Hispanics or Latinos and percentage of females with a disability in the United States with a correlation coefficient (R) of -0.253 and weighted average of 12.5%. Similarly, the statistical analysis conducted on geographies consisting of 95,112,364 people shows a poor negative correlation between the proportion of Paraguayans and percentage of females with a disability in the United States with a correlation coefficient (R) of -0.128 and weighted average of 11.2%, a difference of 11.1%.
Female Disability Correlation Summary
| Measurement | Hispanic or Latino | Paraguayan |
| Minimum | 8.9% | 2.8% |
| Maximum | 16.7% | 20.4% |
| Range | 7.8% | 17.6% |
| Mean | 12.5% | 11.1% |
| Median | 12.5% | 10.5% |
| Interquartile 25% (IQ1) | 11.9% | 9.3% |
| Interquartile 75% (IQ3) | 13.1% | 12.5% |
| Interquartile Range (IQR) | 1.2% | 3.2% |
| Standard Deviation (Sample) | 1.1% | 3.5% |
| Standard Deviation (Population) | 1.1% | 3.5% |
Similar Demographics by Female Disability
Demographics Similar to Hispanics or Latinos by Female Disability
In terms of female disability, the demographic groups most similar to Hispanics or Latinos are Assyrian/Chaldean/Syriac (12.5%, a difference of 0.010%), Immigrants from Cambodia (12.5%, a difference of 0.030%), Polish (12.5%, a difference of 0.050%), Hungarian (12.5%, a difference of 0.11%), and Immigrants from Belize (12.5%, a difference of 0.14%).
| Demographics | Rating | Rank | Female Disability |
| Europeans | 12.1 /100 | #219 | Poor 12.4% |
| Bahamians | 11.1 /100 | #220 | Poor 12.4% |
| Native Hawaiians | 10.8 /100 | #221 | Poor 12.4% |
| Italians | 10.7 /100 | #222 | Poor 12.4% |
| Guamanians/Chamorros | 9.5 /100 | #223 | Tragic 12.5% |
| Belizeans | 9.3 /100 | #224 | Tragic 12.5% |
| Poles | 8.4 /100 | #225 | Tragic 12.5% |
| Hispanics or Latinos | 8.0 /100 | #226 | Tragic 12.5% |
| Assyrians/Chaldeans/Syriacs | 8.0 /100 | #227 | Tragic 12.5% |
| Immigrants | Cambodia | 7.8 /100 | #228 | Tragic 12.5% |
| Hungarians | 7.2 /100 | #229 | Tragic 12.5% |
| Immigrants | Belize | 7.0 /100 | #230 | Tragic 12.5% |
| Belgians | 6.5 /100 | #231 | Tragic 12.5% |
| Immigrants | Somalia | 5.9 /100 | #232 | Tragic 12.5% |
| Immigrants | Iraq | 5.3 /100 | #233 | Tragic 12.5% |
Demographics Similar to Paraguayans by Female Disability
In terms of female disability, the demographic groups most similar to Paraguayans are Mongolian (11.2%, a difference of 0.020%), Immigrants from Lithuania (11.2%, a difference of 0.050%), Israeli (11.2%, a difference of 0.10%), Afghan (11.2%, a difference of 0.12%), and Immigrants from Ethiopia (11.2%, a difference of 0.26%).
| Demographics | Rating | Rank | Female Disability |
| Immigrants | Indonesia | 100.0 /100 | #34 | Exceptional 11.2% |
| Immigrants | Japan | 100.0 /100 | #35 | Exceptional 11.2% |
| Cypriots | 100.0 /100 | #36 | Exceptional 11.2% |
| Ethiopians | 100.0 /100 | #37 | Exceptional 11.2% |
| Immigrants | Ethiopia | 100.0 /100 | #38 | Exceptional 11.2% |
| Immigrants | Lithuania | 100.0 /100 | #39 | Exceptional 11.2% |
| Mongolians | 100.0 /100 | #40 | Exceptional 11.2% |
| Paraguayans | 100.0 /100 | #41 | Exceptional 11.2% |
| Israelis | 100.0 /100 | #42 | Exceptional 11.2% |
| Afghans | 100.0 /100 | #43 | Exceptional 11.2% |
| Cambodians | 100.0 /100 | #44 | Exceptional 11.3% |
| Immigrants | Sweden | 100.0 /100 | #45 | Exceptional 11.3% |
| Immigrants | Nepal | 100.0 /100 | #46 | Exceptional 11.3% |
| Jordanians | 100.0 /100 | #47 | Exceptional 11.3% |
| Zimbabweans | 100.0 /100 | #48 | Exceptional 11.3% |