Hawaiian vs Immigrants from Syria Vision Disability
COMPARE
Hawaiian
Immigrants from Syria
Vision Disability
Vision Disability Comparison
Hawaiians
Immigrants from Syria
2.3%
VISION DISABILITY
2.9/ 100
METRIC RATING
227th/ 347
METRIC RANK
2.1%
VISION DISABILITY
96.2/ 100
METRIC RATING
92nd/ 347
METRIC RANK
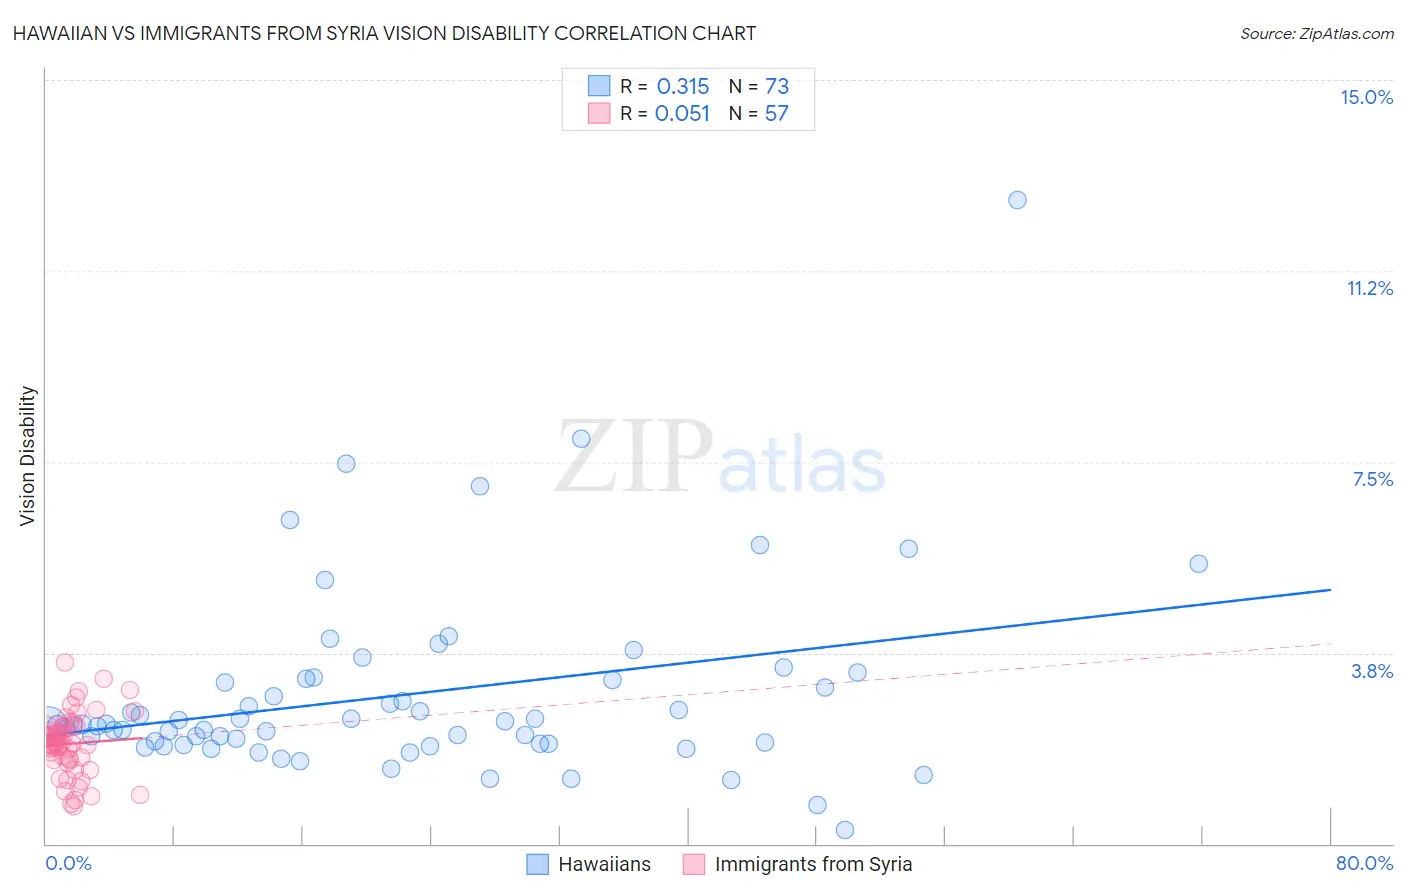
Hawaiian vs Immigrants from Syria Vision Disability Correlation Chart
The statistical analysis conducted on geographies consisting of 327,342,922 people shows a mild positive correlation between the proportion of Hawaiians and percentage of population with vision disability in the United States with a correlation coefficient (R) of 0.315 and weighted average of 2.3%. Similarly, the statistical analysis conducted on geographies consisting of 174,077,138 people shows a slight positive correlation between the proportion of Immigrants from Syria and percentage of population with vision disability in the United States with a correlation coefficient (R) of 0.051 and weighted average of 2.1%, a difference of 11.2%.
Vision Disability Correlation Summary
| Measurement | Hawaiian | Immigrants from Syria |
| Minimum | 0.26% | 0.73% |
| Maximum | 12.7% | 3.6% |
| Range | 12.4% | 2.8% |
| Mean | 2.9% | 2.0% |
| Median | 2.3% | 2.0% |
| Interquartile 25% (IQ1) | 2.0% | 1.6% |
| Interquartile 75% (IQ3) | 3.2% | 2.3% |
| Interquartile Range (IQR) | 1.3% | 0.65% |
| Standard Deviation (Sample) | 1.9% | 0.61% |
| Standard Deviation (Population) | 1.9% | 0.61% |
Similar Demographics by Vision Disability
Demographics Similar to Hawaiians by Vision Disability
In terms of vision disability, the demographic groups most similar to Hawaiians are Immigrants from Germany (2.3%, a difference of 0.050%), Hmong (2.3%, a difference of 0.24%), Immigrants from Western Africa (2.3%, a difference of 0.27%), Irish (2.3%, a difference of 0.28%), and Basque (2.3%, a difference of 0.31%).
| Demographics | Rating | Rank | Vision Disability |
| Guamanians/Chamorros | 3.9 /100 | #220 | Tragic 2.3% |
| French Canadians | 3.9 /100 | #221 | Tragic 2.3% |
| Immigrants | Senegal | 3.8 /100 | #222 | Tragic 2.3% |
| Basques | 3.5 /100 | #223 | Tragic 2.3% |
| Irish | 3.4 /100 | #224 | Tragic 2.3% |
| Immigrants | Western Africa | 3.4 /100 | #225 | Tragic 2.3% |
| Immigrants | Germany | 3.0 /100 | #226 | Tragic 2.3% |
| Hawaiians | 2.9 /100 | #227 | Tragic 2.3% |
| Hmong | 2.5 /100 | #228 | Tragic 2.3% |
| Welsh | 2.3 /100 | #229 | Tragic 2.3% |
| Nicaraguans | 2.2 /100 | #230 | Tragic 2.3% |
| Immigrants | Ecuador | 2.0 /100 | #231 | Tragic 2.3% |
| German Russians | 1.8 /100 | #232 | Tragic 2.3% |
| Central Americans | 1.8 /100 | #233 | Tragic 2.3% |
| Scottish | 1.6 /100 | #234 | Tragic 2.3% |
Demographics Similar to Immigrants from Syria by Vision Disability
In terms of vision disability, the demographic groups most similar to Immigrants from Syria are Immigrants from Somalia (2.1%, a difference of 0.020%), Immigrants from Europe (2.1%, a difference of 0.050%), Immigrants from Croatia (2.1%, a difference of 0.070%), Australian (2.1%, a difference of 0.14%), and Romanian (2.1%, a difference of 0.20%).
| Demographics | Rating | Rank | Vision Disability |
| Chinese | 97.2 /100 | #85 | Exceptional 2.0% |
| Immigrants | Moldova | 97.2 /100 | #86 | Exceptional 2.0% |
| Immigrants | Switzerland | 97.0 /100 | #87 | Exceptional 2.0% |
| Norwegians | 97.0 /100 | #88 | Exceptional 2.0% |
| Immigrants | Eastern Africa | 97.0 /100 | #89 | Exceptional 2.0% |
| Immigrants | Lebanon | 96.7 /100 | #90 | Exceptional 2.1% |
| Immigrants | Somalia | 96.2 /100 | #91 | Exceptional 2.1% |
| Immigrants | Syria | 96.2 /100 | #92 | Exceptional 2.1% |
| Immigrants | Europe | 96.1 /100 | #93 | Exceptional 2.1% |
| Immigrants | Croatia | 96.0 /100 | #94 | Exceptional 2.1% |
| Australians | 95.9 /100 | #95 | Exceptional 2.1% |
| Romanians | 95.7 /100 | #96 | Exceptional 2.1% |
| Immigrants | Afghanistan | 95.6 /100 | #97 | Exceptional 2.1% |
| Immigrants | South Africa | 95.4 /100 | #98 | Exceptional 2.1% |
| Estonians | 95.3 /100 | #99 | Exceptional 2.1% |