Hawaiian vs Immigrants from Bulgaria Vision Disability
COMPARE
Hawaiian
Immigrants from Bulgaria
Vision Disability
Vision Disability Comparison
Hawaiians
Immigrants from Bulgaria
2.3%
VISION DISABILITY
2.9/ 100
METRIC RATING
227th/ 347
METRIC RANK
2.0%
VISION DISABILITY
99.7/ 100
METRIC RATING
47th/ 347
METRIC RANK
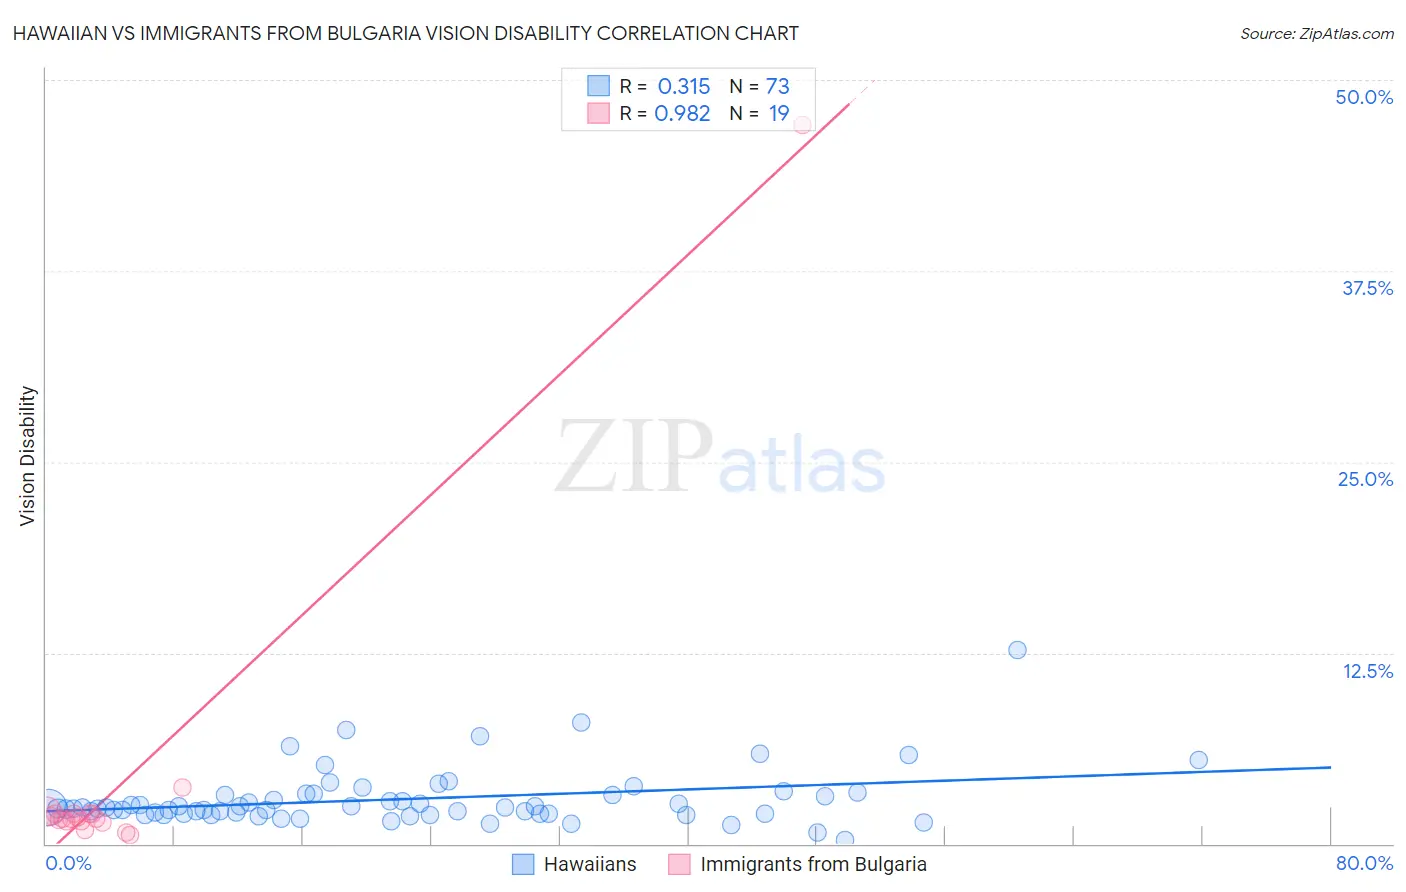
Hawaiian vs Immigrants from Bulgaria Vision Disability Correlation Chart
The statistical analysis conducted on geographies consisting of 327,342,922 people shows a mild positive correlation between the proportion of Hawaiians and percentage of population with vision disability in the United States with a correlation coefficient (R) of 0.315 and weighted average of 2.3%. Similarly, the statistical analysis conducted on geographies consisting of 172,526,022 people shows a perfect positive correlation between the proportion of Immigrants from Bulgaria and percentage of population with vision disability in the United States with a correlation coefficient (R) of 0.982 and weighted average of 2.0%, a difference of 15.9%.
Vision Disability Correlation Summary
| Measurement | Hawaiian | Immigrants from Bulgaria |
| Minimum | 0.26% | 0.56% |
| Maximum | 12.7% | 47.1% |
| Range | 12.4% | 46.5% |
| Mean | 2.9% | 4.1% |
| Median | 2.3% | 1.6% |
| Interquartile 25% (IQ1) | 2.0% | 1.5% |
| Interquartile 75% (IQ3) | 3.2% | 2.0% |
| Interquartile Range (IQR) | 1.3% | 0.48% |
| Standard Deviation (Sample) | 1.9% | 10.4% |
| Standard Deviation (Population) | 1.9% | 10.2% |
Similar Demographics by Vision Disability
Demographics Similar to Hawaiians by Vision Disability
In terms of vision disability, the demographic groups most similar to Hawaiians are Immigrants from Germany (2.3%, a difference of 0.050%), Hmong (2.3%, a difference of 0.24%), Immigrants from Western Africa (2.3%, a difference of 0.27%), Irish (2.3%, a difference of 0.28%), and Basque (2.3%, a difference of 0.31%).
| Demographics | Rating | Rank | Vision Disability |
| Guamanians/Chamorros | 3.9 /100 | #220 | Tragic 2.3% |
| French Canadians | 3.9 /100 | #221 | Tragic 2.3% |
| Immigrants | Senegal | 3.8 /100 | #222 | Tragic 2.3% |
| Basques | 3.5 /100 | #223 | Tragic 2.3% |
| Irish | 3.4 /100 | #224 | Tragic 2.3% |
| Immigrants | Western Africa | 3.4 /100 | #225 | Tragic 2.3% |
| Immigrants | Germany | 3.0 /100 | #226 | Tragic 2.3% |
| Hawaiians | 2.9 /100 | #227 | Tragic 2.3% |
| Hmong | 2.5 /100 | #228 | Tragic 2.3% |
| Welsh | 2.3 /100 | #229 | Tragic 2.3% |
| Nicaraguans | 2.2 /100 | #230 | Tragic 2.3% |
| Immigrants | Ecuador | 2.0 /100 | #231 | Tragic 2.3% |
| German Russians | 1.8 /100 | #232 | Tragic 2.3% |
| Central Americans | 1.8 /100 | #233 | Tragic 2.3% |
| Scottish | 1.6 /100 | #234 | Tragic 2.3% |
Demographics Similar to Immigrants from Bulgaria by Vision Disability
In terms of vision disability, the demographic groups most similar to Immigrants from Bulgaria are Immigrants from Sweden (2.0%, a difference of 0.020%), Ethiopian (2.0%, a difference of 0.060%), Immigrants from Indonesia (2.0%, a difference of 0.090%), Eastern European (2.0%, a difference of 0.11%), and Immigrants from Ethiopia (2.0%, a difference of 0.17%).
| Demographics | Rating | Rank | Vision Disability |
| Immigrants | Ireland | 99.7 /100 | #40 | Exceptional 2.0% |
| Cypriots | 99.7 /100 | #41 | Exceptional 2.0% |
| Immigrants | Ethiopia | 99.7 /100 | #42 | Exceptional 2.0% |
| Eastern Europeans | 99.7 /100 | #43 | Exceptional 2.0% |
| Immigrants | Indonesia | 99.7 /100 | #44 | Exceptional 2.0% |
| Ethiopians | 99.7 /100 | #45 | Exceptional 2.0% |
| Immigrants | Sweden | 99.7 /100 | #46 | Exceptional 2.0% |
| Immigrants | Bulgaria | 99.7 /100 | #47 | Exceptional 2.0% |
| Israelis | 99.6 /100 | #48 | Exceptional 2.0% |
| Latvians | 99.5 /100 | #49 | Exceptional 2.0% |
| Afghans | 99.5 /100 | #50 | Exceptional 2.0% |
| Tongans | 99.5 /100 | #51 | Exceptional 2.0% |
| Immigrants | Serbia | 99.4 /100 | #52 | Exceptional 2.0% |
| Immigrants | Belarus | 99.3 /100 | #53 | Exceptional 2.0% |
| Macedonians | 99.3 /100 | #54 | Exceptional 2.0% |