Haitian vs Alaskan Athabascan Cognitive Disability
COMPARE
Haitian
Alaskan Athabascan
Cognitive Disability
Cognitive Disability Comparison
Haitians
Alaskan Athabascans
17.5%
COGNITIVE DISABILITY
14.1/ 100
METRIC RATING
200th/ 347
METRIC RANK
17.6%
COGNITIVE DISABILITY
6.9/ 100
METRIC RATING
215th/ 347
METRIC RANK
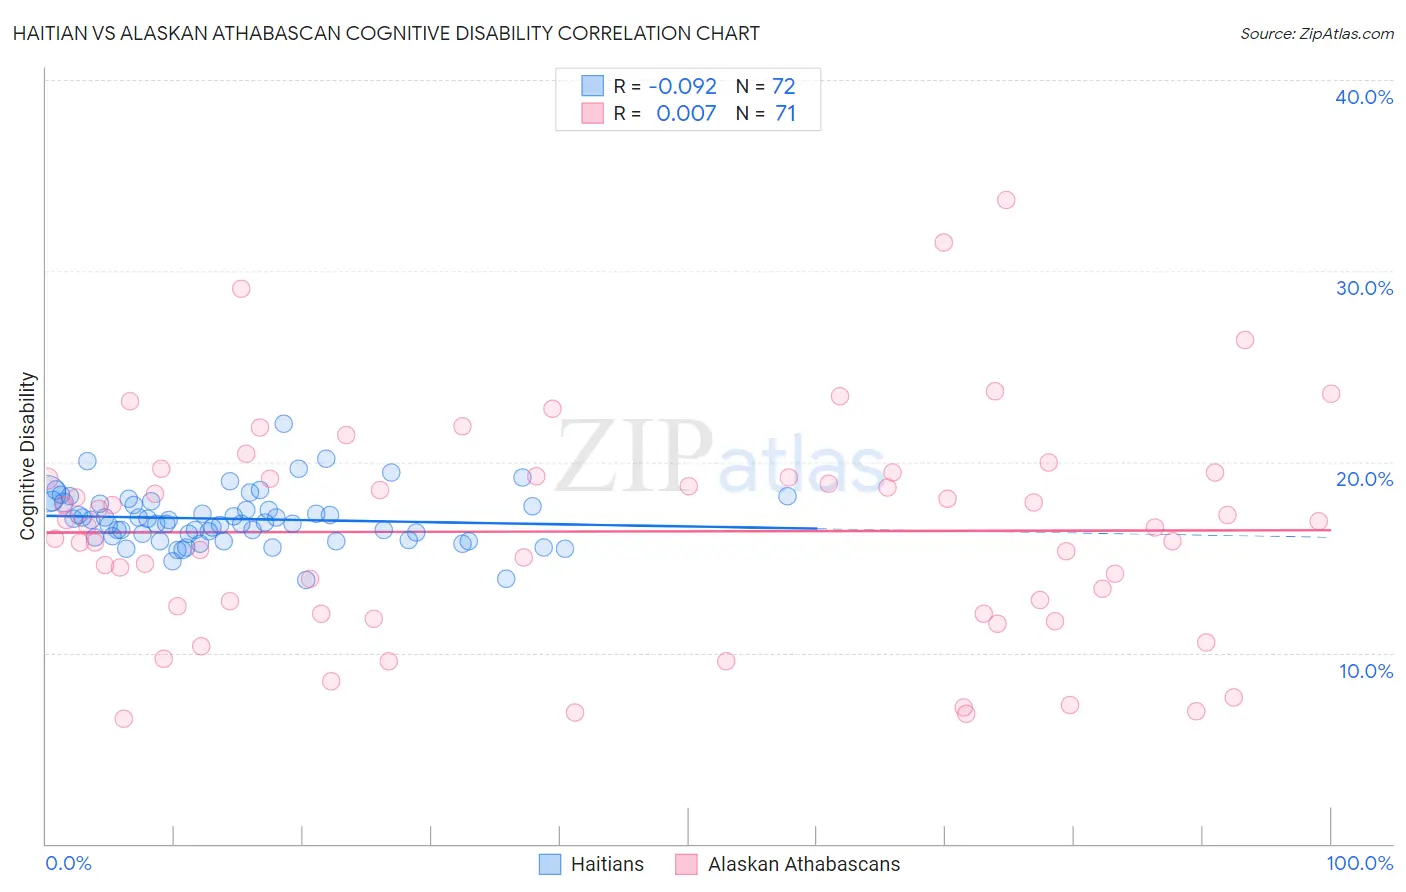
Haitian vs Alaskan Athabascan Cognitive Disability Correlation Chart
The statistical analysis conducted on geographies consisting of 287,929,830 people shows a slight negative correlation between the proportion of Haitians and percentage of population with cognitive disability in the United States with a correlation coefficient (R) of -0.092 and weighted average of 17.5%. Similarly, the statistical analysis conducted on geographies consisting of 45,820,962 people shows no correlation between the proportion of Alaskan Athabascans and percentage of population with cognitive disability in the United States with a correlation coefficient (R) of 0.007 and weighted average of 17.6%, a difference of 0.56%.
Cognitive Disability Correlation Summary
| Measurement | Haitian | Alaskan Athabascan |
| Minimum | 13.8% | 6.5% |
| Maximum | 22.0% | 33.7% |
| Range | 8.2% | 27.2% |
| Mean | 17.0% | 16.4% |
| Median | 16.9% | 16.6% |
| Interquartile 25% (IQ1) | 16.1% | 12.1% |
| Interquartile 75% (IQ3) | 17.8% | 19.2% |
| Interquartile Range (IQR) | 1.8% | 7.2% |
| Standard Deviation (Sample) | 1.4% | 5.7% |
| Standard Deviation (Population) | 1.4% | 5.7% |
Demographics Similar to Haitians and Alaskan Athabascans by Cognitive Disability
In terms of cognitive disability, the demographic groups most similar to Haitians are Immigrants from Singapore (17.5%, a difference of 0.010%), Immigrants from Panama (17.5%, a difference of 0.040%), South American Indian (17.5%, a difference of 0.070%), Immigrants from Morocco (17.5%, a difference of 0.13%), and Immigrants from Afghanistan (17.5%, a difference of 0.14%). Similarly, the demographic groups most similar to Alaskan Athabascans are Immigrants from El Salvador (17.6%, a difference of 0.010%), Okinawan (17.6%, a difference of 0.010%), Salvadoran (17.6%, a difference of 0.020%), Hawaiian (17.6%, a difference of 0.030%), and Immigrants from Oceania (17.6%, a difference of 0.050%).
| Demographics | Rating | Rank | Cognitive Disability |
| Immigrants | Afghanistan | 16.7 /100 | #197 | Poor 17.5% |
| Immigrants | Panama | 14.8 /100 | #198 | Poor 17.5% |
| Immigrants | Singapore | 14.3 /100 | #199 | Poor 17.5% |
| Haitians | 14.1 /100 | #200 | Poor 17.5% |
| South American Indians | 13.0 /100 | #201 | Poor 17.5% |
| Immigrants | Morocco | 12.0 /100 | #202 | Poor 17.5% |
| Immigrants | Caribbean | 11.0 /100 | #203 | Poor 17.5% |
| Immigrants | Zimbabwe | 11.0 /100 | #204 | Poor 17.5% |
| Puget Sound Salish | 10.9 /100 | #205 | Poor 17.5% |
| Alaska Natives | 10.4 /100 | #206 | Poor 17.5% |
| Immigrants | Latin America | 9.7 /100 | #207 | Tragic 17.6% |
| Immigrants | Cameroon | 9.3 /100 | #208 | Tragic 17.6% |
| Immigrants | Trinidad and Tobago | 8.7 /100 | #209 | Tragic 17.6% |
| Immigrants | Jamaica | 8.5 /100 | #210 | Tragic 17.6% |
| Taiwanese | 7.7 /100 | #211 | Tragic 17.6% |
| Immigrants | Oceania | 7.3 /100 | #212 | Tragic 17.6% |
| Hawaiians | 7.2 /100 | #213 | Tragic 17.6% |
| Immigrants | El Salvador | 7.0 /100 | #214 | Tragic 17.6% |
| Alaskan Athabascans | 6.9 /100 | #215 | Tragic 17.6% |
| Okinawans | 6.8 /100 | #216 | Tragic 17.6% |
| Salvadorans | 6.7 /100 | #217 | Tragic 17.6% |