Haitian vs White/Caucasian Cognitive Disability
COMPARE
Haitian
White/Caucasian
Cognitive Disability
Cognitive Disability Comparison
Haitians
Whites/Caucasians
17.5%
COGNITIVE DISABILITY
14.1/ 100
METRIC RATING
200th/ 347
METRIC RANK
17.0%
COGNITIVE DISABILITY
92.1/ 100
METRIC RATING
132nd/ 347
METRIC RANK
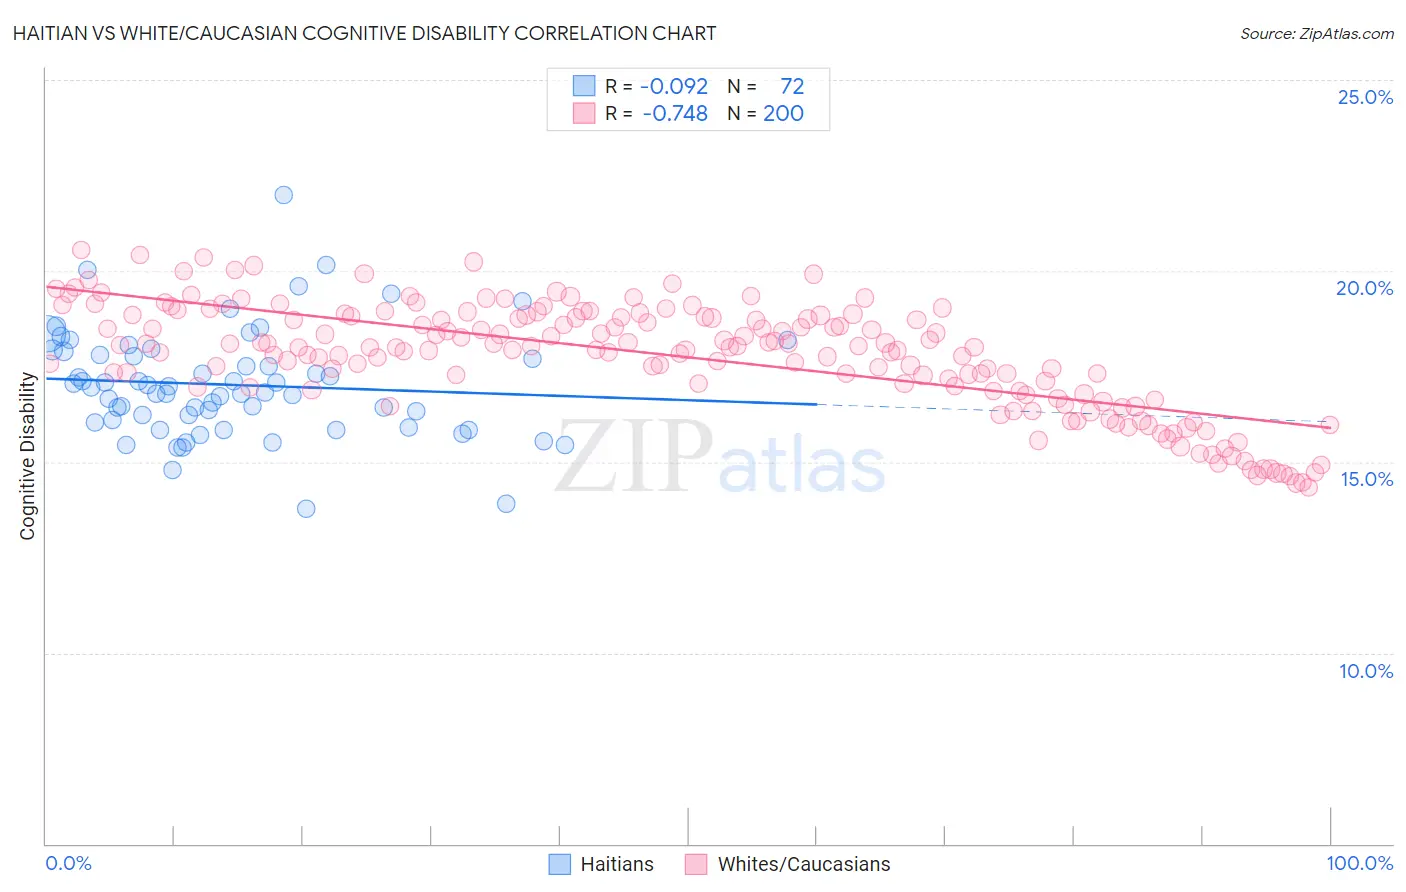
Haitian vs White/Caucasian Cognitive Disability Correlation Chart
The statistical analysis conducted on geographies consisting of 287,929,830 people shows a slight negative correlation between the proportion of Haitians and percentage of population with cognitive disability in the United States with a correlation coefficient (R) of -0.092 and weighted average of 17.5%. Similarly, the statistical analysis conducted on geographies consisting of 584,856,433 people shows a strong negative correlation between the proportion of Whites/Caucasians and percentage of population with cognitive disability in the United States with a correlation coefficient (R) of -0.748 and weighted average of 17.0%, a difference of 3.1%.
Cognitive Disability Correlation Summary
| Measurement | Haitian | White/Caucasian |
| Minimum | 13.8% | 14.3% |
| Maximum | 22.0% | 20.5% |
| Range | 8.2% | 6.2% |
| Mean | 17.0% | 17.7% |
| Median | 16.9% | 18.0% |
| Interquartile 25% (IQ1) | 16.1% | 16.9% |
| Interquartile 75% (IQ3) | 17.8% | 18.8% |
| Interquartile Range (IQR) | 1.8% | 1.9% |
| Standard Deviation (Sample) | 1.4% | 1.4% |
| Standard Deviation (Population) | 1.4% | 1.4% |
Similar Demographics by Cognitive Disability
Demographics Similar to Haitians by Cognitive Disability
In terms of cognitive disability, the demographic groups most similar to Haitians are Immigrants from Singapore (17.5%, a difference of 0.010%), Immigrants from Panama (17.5%, a difference of 0.040%), South American Indian (17.5%, a difference of 0.070%), Immigrants from Morocco (17.5%, a difference of 0.13%), and Immigrants from Afghanistan (17.5%, a difference of 0.14%).
| Demographics | Rating | Rank | Cognitive Disability |
| Delaware | 25.6 /100 | #193 | Fair 17.4% |
| Immigrants | Bosnia and Herzegovina | 22.0 /100 | #194 | Fair 17.4% |
| New Zealanders | 21.1 /100 | #195 | Fair 17.4% |
| Guyanese | 17.5 /100 | #196 | Poor 17.5% |
| Immigrants | Afghanistan | 16.7 /100 | #197 | Poor 17.5% |
| Immigrants | Panama | 14.8 /100 | #198 | Poor 17.5% |
| Immigrants | Singapore | 14.3 /100 | #199 | Poor 17.5% |
| Haitians | 14.1 /100 | #200 | Poor 17.5% |
| South American Indians | 13.0 /100 | #201 | Poor 17.5% |
| Immigrants | Morocco | 12.0 /100 | #202 | Poor 17.5% |
| Immigrants | Caribbean | 11.0 /100 | #203 | Poor 17.5% |
| Immigrants | Zimbabwe | 11.0 /100 | #204 | Poor 17.5% |
| Puget Sound Salish | 10.9 /100 | #205 | Poor 17.5% |
| Alaska Natives | 10.4 /100 | #206 | Poor 17.5% |
| Immigrants | Latin America | 9.7 /100 | #207 | Tragic 17.6% |
Demographics Similar to Whites/Caucasians by Cognitive Disability
In terms of cognitive disability, the demographic groups most similar to Whites/Caucasians are Immigrants from Germany (17.0%, a difference of 0.0%), Immigrants from Vietnam (17.0%, a difference of 0.020%), Immigrants from Jordan (17.0%, a difference of 0.030%), Immigrants from Chile (17.0%, a difference of 0.040%), and Immigrants from Uruguay (17.0%, a difference of 0.080%).
| Demographics | Rating | Rank | Cognitive Disability |
| Scandinavians | 94.1 /100 | #125 | Exceptional 16.9% |
| Europeans | 93.4 /100 | #126 | Exceptional 17.0% |
| Immigrants | Costa Rica | 93.1 /100 | #127 | Exceptional 17.0% |
| Nicaraguans | 93.0 /100 | #128 | Exceptional 17.0% |
| Immigrants | Uruguay | 92.9 /100 | #129 | Exceptional 17.0% |
| Immigrants | Vietnam | 92.4 /100 | #130 | Exceptional 17.0% |
| Immigrants | Germany | 92.1 /100 | #131 | Exceptional 17.0% |
| Whites/Caucasians | 92.1 /100 | #132 | Exceptional 17.0% |
| Immigrants | Jordan | 91.9 /100 | #133 | Exceptional 17.0% |
| Immigrants | Chile | 91.7 /100 | #134 | Exceptional 17.0% |
| Lebanese | 91.3 /100 | #135 | Exceptional 17.0% |
| Israelis | 91.0 /100 | #136 | Exceptional 17.0% |
| Immigrants | Norway | 90.9 /100 | #137 | Exceptional 17.0% |
| Welsh | 90.8 /100 | #138 | Exceptional 17.0% |
| French | 90.0 /100 | #139 | Excellent 17.0% |