Immigrants from Spain vs Immigrants from Thailand Disability Age Under 5
COMPARE
Immigrants from Spain
Immigrants from Thailand
Disability Age Under 5
Disability Age Under 5 Comparison
Immigrants from Spain
Immigrants from Thailand
1.2%
DISABILITY AGE UNDER 5
86.5/ 100
METRIC RATING
133rd/ 347
METRIC RANK
1.2%
DISABILITY AGE UNDER 5
69.4/ 100
METRIC RATING
153rd/ 347
METRIC RANK
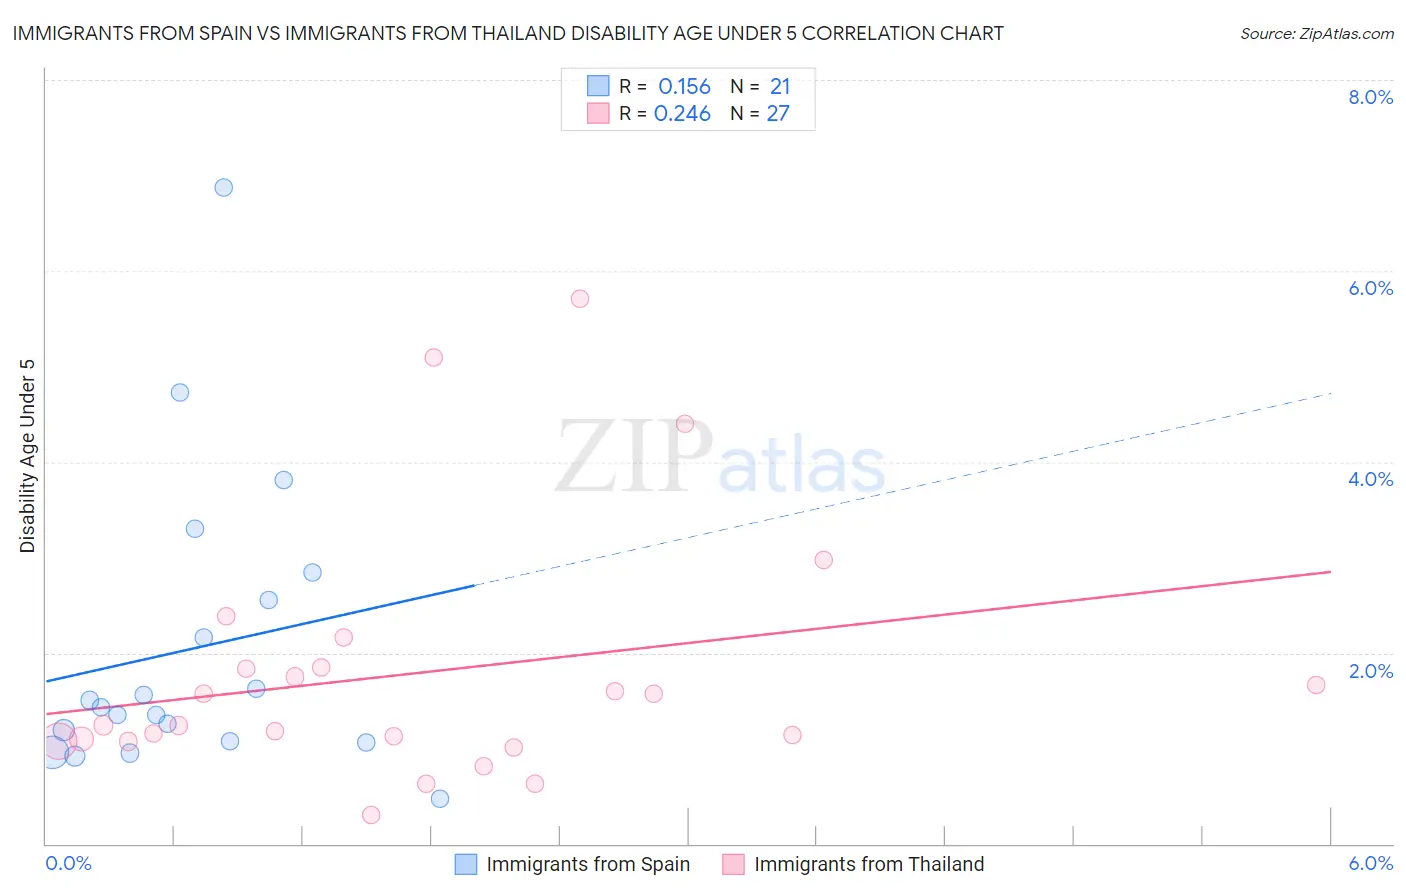
Immigrants from Spain vs Immigrants from Thailand Disability Age Under 5 Correlation Chart
The statistical analysis conducted on geographies consisting of 150,109,645 people shows a poor positive correlation between the proportion of Immigrants from Spain and percentage of population with a disability under the age of 5 in the United States with a correlation coefficient (R) of 0.156 and weighted average of 1.2%. Similarly, the statistical analysis conducted on geographies consisting of 187,942,657 people shows a weak positive correlation between the proportion of Immigrants from Thailand and percentage of population with a disability under the age of 5 in the United States with a correlation coefficient (R) of 0.246 and weighted average of 1.2%, a difference of 2.5%.
Disability Age Under 5 Correlation Summary
| Measurement | Immigrants from Spain | Immigrants from Thailand |
| Minimum | 0.48% | 0.30% |
| Maximum | 6.9% | 5.7% |
| Range | 6.4% | 5.4% |
| Mean | 2.0% | 1.8% |
| Median | 1.4% | 1.2% |
| Interquartile 25% (IQ1) | 1.1% | 1.1% |
| Interquartile 75% (IQ3) | 2.7% | 1.9% |
| Interquartile Range (IQR) | 1.6% | 0.78% |
| Standard Deviation (Sample) | 1.5% | 1.3% |
| Standard Deviation (Population) | 1.5% | 1.3% |
Demographics Similar to Immigrants from Spain and Immigrants from Thailand by Disability Age Under 5
In terms of disability age under 5, the demographic groups most similar to Immigrants from Spain are Argentinean (1.2%, a difference of 0.16%), Fijian (1.2%, a difference of 0.36%), Moroccan (1.2%, a difference of 0.54%), Immigrants from Eastern Africa (1.2%, a difference of 0.63%), and Immigrants from Czechoslovakia (1.2%, a difference of 0.68%). Similarly, the demographic groups most similar to Immigrants from Thailand are Honduran (1.2%, a difference of 0.34%), Yaqui (1.2%, a difference of 0.62%), South American (1.2%, a difference of 0.72%), Kenyan (1.2%, a difference of 0.76%), and Ghanaian (1.2%, a difference of 0.80%).
| Demographics | Rating | Rank | Disability Age Under 5 |
| Immigrants | Spain | 86.5 /100 | #133 | Excellent 1.2% |
| Argentineans | 85.7 /100 | #134 | Excellent 1.2% |
| Fijians | 84.7 /100 | #135 | Excellent 1.2% |
| Moroccans | 83.6 /100 | #136 | Excellent 1.2% |
| Immigrants | Eastern Africa | 83.1 /100 | #137 | Excellent 1.2% |
| Immigrants | Czechoslovakia | 82.8 /100 | #138 | Excellent 1.2% |
| New Zealanders | 81.4 /100 | #139 | Excellent 1.2% |
| Somalis | 80.8 /100 | #140 | Excellent 1.2% |
| Immigrants | Honduras | 80.4 /100 | #141 | Excellent 1.2% |
| Immigrants | Colombia | 79.3 /100 | #142 | Good 1.2% |
| Alsatians | 79.3 /100 | #143 | Good 1.2% |
| Immigrants | Middle Africa | 79.3 /100 | #144 | Good 1.2% |
| Immigrants | Zimbabwe | 77.9 /100 | #145 | Good 1.2% |
| Samoans | 77.7 /100 | #146 | Good 1.2% |
| Icelanders | 76.3 /100 | #147 | Good 1.2% |
| Ghanaians | 76.3 /100 | #148 | Good 1.2% |
| Kenyans | 75.9 /100 | #149 | Good 1.2% |
| South Americans | 75.6 /100 | #150 | Good 1.2% |
| Yaqui | 74.8 /100 | #151 | Good 1.2% |
| Hondurans | 72.5 /100 | #152 | Good 1.2% |
| Immigrants | Thailand | 69.4 /100 | #153 | Good 1.2% |