Guyanese vs Immigrants from Bahamas Disability Age Under 5
COMPARE
Guyanese
Immigrants from Bahamas
Disability Age Under 5
Disability Age Under 5 Comparison
Guyanese
Immigrants from Bahamas
1.0%
DISABILITY AGE UNDER 5
100.0/ 100
METRIC RATING
27th/ 347
METRIC RANK
1.2%
DISABILITY AGE UNDER 5
45.2/ 100
METRIC RATING
179th/ 347
METRIC RANK
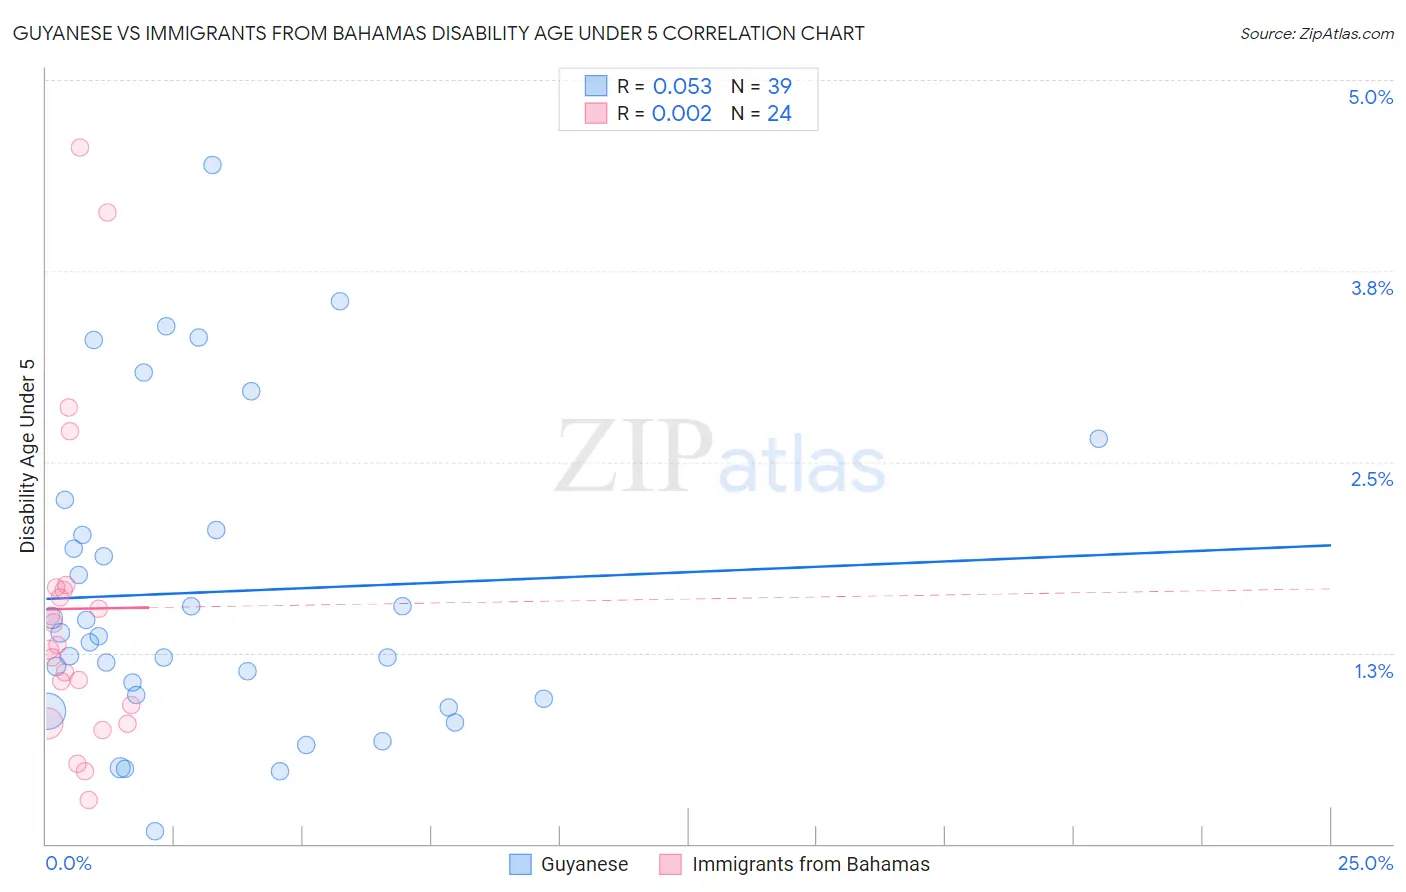
Guyanese vs Immigrants from Bahamas Disability Age Under 5 Correlation Chart
The statistical analysis conducted on geographies consisting of 114,513,627 people shows a slight positive correlation between the proportion of Guyanese and percentage of population with a disability under the age of 5 in the United States with a correlation coefficient (R) of 0.053 and weighted average of 1.0%. Similarly, the statistical analysis conducted on geographies consisting of 77,902,509 people shows no correlation between the proportion of Immigrants from Bahamas and percentage of population with a disability under the age of 5 in the United States with a correlation coefficient (R) of 0.002 and weighted average of 1.2%, a difference of 22.7%.
Disability Age Under 5 Correlation Summary
| Measurement | Guyanese | Immigrants from Bahamas |
| Minimum | 0.086% | 0.28% |
| Maximum | 4.4% | 4.6% |
| Range | 4.4% | 4.3% |
| Mean | 1.6% | 1.5% |
| Median | 1.4% | 1.3% |
| Interquartile 25% (IQ1) | 0.95% | 0.85% |
| Interquartile 75% (IQ3) | 2.1% | 1.7% |
| Interquartile Range (IQR) | 1.1% | 0.82% |
| Standard Deviation (Sample) | 1.0% | 1.1% |
| Standard Deviation (Population) | 1.00% | 1.0% |
Similar Demographics by Disability Age Under 5
Demographics Similar to Guyanese by Disability Age Under 5
In terms of disability age under 5, the demographic groups most similar to Guyanese are Immigrants from Eastern Asia (1.0%, a difference of 0.63%), Immigrants from Belarus (1.0%, a difference of 0.76%), Immigrants from Taiwan (1.0%, a difference of 0.84%), Immigrants from Micronesia (1.0%, a difference of 0.97%), and Indian (Asian) (1.0%, a difference of 1.3%).
| Demographics | Rating | Rank | Disability Age Under 5 |
| Nepalese | 100.0 /100 | #20 | Exceptional 0.97% |
| British West Indians | 100.0 /100 | #21 | Exceptional 0.99% |
| Immigrants | Iran | 100.0 /100 | #22 | Exceptional 1.00% |
| Yakama | 100.0 /100 | #23 | Exceptional 1.00% |
| Indians (Asian) | 100.0 /100 | #24 | Exceptional 1.0% |
| Immigrants | Micronesia | 100.0 /100 | #25 | Exceptional 1.0% |
| Immigrants | Taiwan | 100.0 /100 | #26 | Exceptional 1.0% |
| Guyanese | 100.0 /100 | #27 | Exceptional 1.0% |
| Immigrants | Eastern Asia | 100.0 /100 | #28 | Exceptional 1.0% |
| Immigrants | Belarus | 100.0 /100 | #29 | Exceptional 1.0% |
| Immigrants | South Central Asia | 99.9 /100 | #30 | Exceptional 1.0% |
| Armenians | 99.9 /100 | #31 | Exceptional 1.0% |
| Iranians | 99.9 /100 | #32 | Exceptional 1.0% |
| Bolivians | 99.9 /100 | #33 | Exceptional 1.0% |
| Immigrants | Ukraine | 99.9 /100 | #34 | Exceptional 1.0% |
Demographics Similar to Immigrants from Bahamas by Disability Age Under 5
In terms of disability age under 5, the demographic groups most similar to Immigrants from Bahamas are Immigrants from Mexico (1.2%, a difference of 0.070%), Immigrants from Peru (1.2%, a difference of 0.13%), Macedonian (1.2%, a difference of 0.13%), Venezuelan (1.2%, a difference of 0.17%), and Immigrants from Saudi Arabia (1.2%, a difference of 0.17%).
| Demographics | Rating | Rank | Disability Age Under 5 |
| Crow | 51.0 /100 | #172 | Average 1.2% |
| Immigrants | Ireland | 50.3 /100 | #173 | Average 1.2% |
| Immigrants | Latvia | 50.0 /100 | #174 | Average 1.2% |
| Immigrants | Nigeria | 50.0 /100 | #175 | Average 1.2% |
| Immigrants | Kenya | 48.6 /100 | #176 | Average 1.2% |
| Comanche | 47.5 /100 | #177 | Average 1.2% |
| Venezuelans | 47.1 /100 | #178 | Average 1.2% |
| Immigrants | Bahamas | 45.2 /100 | #179 | Average 1.2% |
| Immigrants | Mexico | 44.4 /100 | #180 | Average 1.2% |
| Immigrants | Peru | 43.7 /100 | #181 | Average 1.2% |
| Macedonians | 43.7 /100 | #181 | Average 1.2% |
| Immigrants | Saudi Arabia | 43.3 /100 | #183 | Average 1.2% |
| Palestinians | 43.0 /100 | #184 | Average 1.2% |
| Immigrants | Western Africa | 42.5 /100 | #185 | Average 1.2% |
| Cubans | 42.5 /100 | #186 | Average 1.2% |