Guyanese vs Immigrants from El Salvador Disability Age Under 5
COMPARE
Guyanese
Immigrants from El Salvador
Disability Age Under 5
Disability Age Under 5 Comparison
Guyanese
Immigrants from El Salvador
1.0%
DISABILITY AGE UNDER 5
100.0/ 100
METRIC RATING
27th/ 347
METRIC RANK
1.1%
DISABILITY AGE UNDER 5
99.6/ 100
METRIC RATING
54th/ 347
METRIC RANK
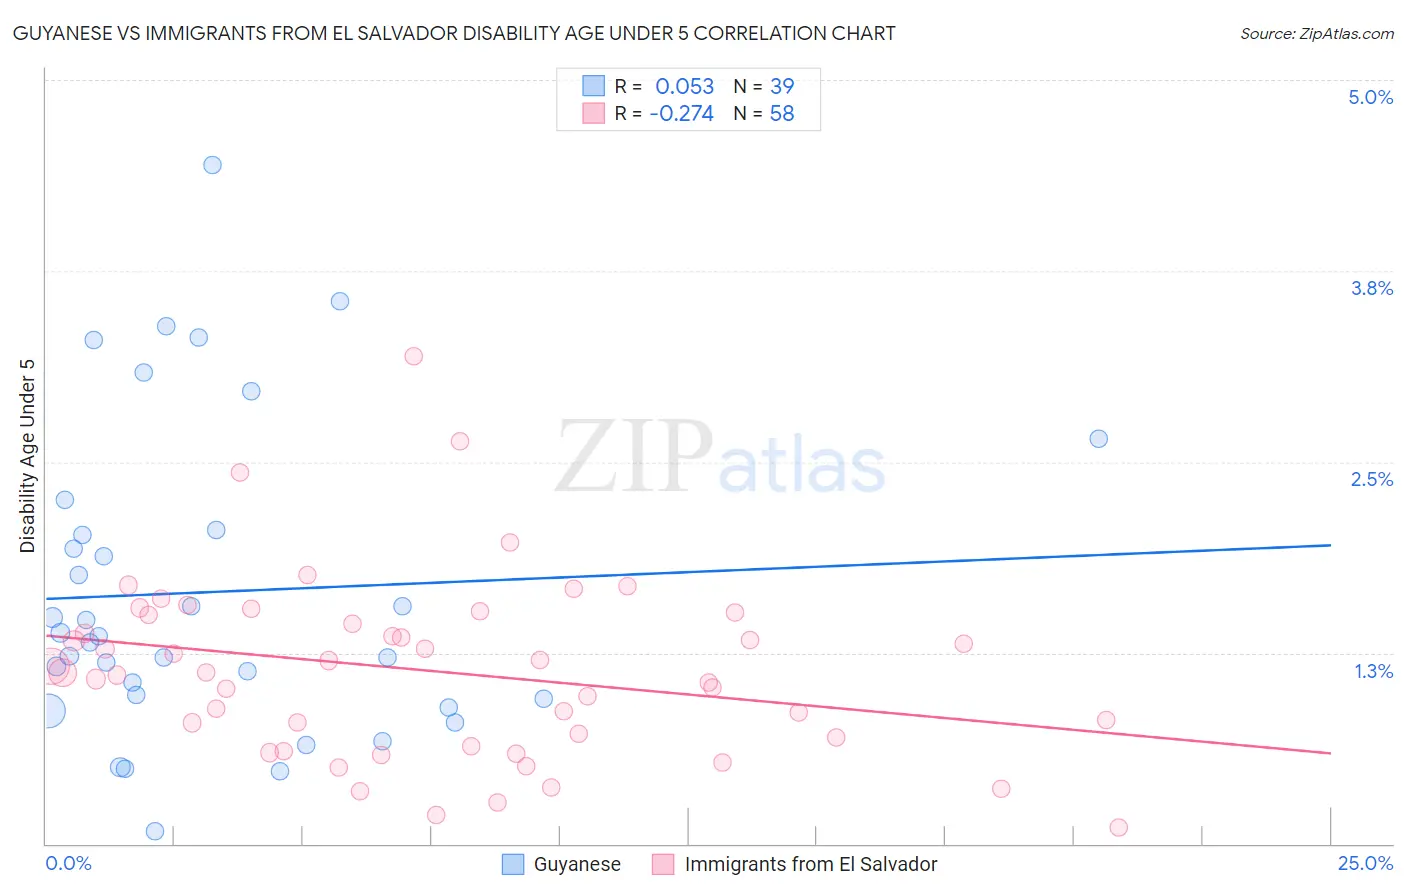
Guyanese vs Immigrants from El Salvador Disability Age Under 5 Correlation Chart
The statistical analysis conducted on geographies consisting of 114,513,627 people shows a slight positive correlation between the proportion of Guyanese and percentage of population with a disability under the age of 5 in the United States with a correlation coefficient (R) of 0.053 and weighted average of 1.0%. Similarly, the statistical analysis conducted on geographies consisting of 204,380,401 people shows a weak negative correlation between the proportion of Immigrants from El Salvador and percentage of population with a disability under the age of 5 in the United States with a correlation coefficient (R) of -0.274 and weighted average of 1.1%, a difference of 7.2%.
Disability Age Under 5 Correlation Summary
| Measurement | Guyanese | Immigrants from El Salvador |
| Minimum | 0.086% | 0.10% |
| Maximum | 4.4% | 3.2% |
| Range | 4.4% | 3.1% |
| Mean | 1.6% | 1.1% |
| Median | 1.4% | 1.1% |
| Interquartile 25% (IQ1) | 0.95% | 0.70% |
| Interquartile 75% (IQ3) | 2.1% | 1.5% |
| Interquartile Range (IQR) | 1.1% | 0.80% |
| Standard Deviation (Sample) | 1.0% | 0.59% |
| Standard Deviation (Population) | 1.00% | 0.58% |
Similar Demographics by Disability Age Under 5
Demographics Similar to Guyanese by Disability Age Under 5
In terms of disability age under 5, the demographic groups most similar to Guyanese are Immigrants from Eastern Asia (1.0%, a difference of 0.63%), Immigrants from Belarus (1.0%, a difference of 0.76%), Immigrants from Taiwan (1.0%, a difference of 0.84%), Immigrants from Micronesia (1.0%, a difference of 0.97%), and Indian (Asian) (1.0%, a difference of 1.3%).
| Demographics | Rating | Rank | Disability Age Under 5 |
| Nepalese | 100.0 /100 | #20 | Exceptional 0.97% |
| British West Indians | 100.0 /100 | #21 | Exceptional 0.99% |
| Immigrants | Iran | 100.0 /100 | #22 | Exceptional 1.00% |
| Yakama | 100.0 /100 | #23 | Exceptional 1.00% |
| Indians (Asian) | 100.0 /100 | #24 | Exceptional 1.0% |
| Immigrants | Micronesia | 100.0 /100 | #25 | Exceptional 1.0% |
| Immigrants | Taiwan | 100.0 /100 | #26 | Exceptional 1.0% |
| Guyanese | 100.0 /100 | #27 | Exceptional 1.0% |
| Immigrants | Eastern Asia | 100.0 /100 | #28 | Exceptional 1.0% |
| Immigrants | Belarus | 100.0 /100 | #29 | Exceptional 1.0% |
| Immigrants | South Central Asia | 99.9 /100 | #30 | Exceptional 1.0% |
| Armenians | 99.9 /100 | #31 | Exceptional 1.0% |
| Iranians | 99.9 /100 | #32 | Exceptional 1.0% |
| Bolivians | 99.9 /100 | #33 | Exceptional 1.0% |
| Immigrants | Ukraine | 99.9 /100 | #34 | Exceptional 1.0% |
Demographics Similar to Immigrants from El Salvador by Disability Age Under 5
In terms of disability age under 5, the demographic groups most similar to Immigrants from El Salvador are Salvadoran (1.1%, a difference of 0.090%), Asian (1.1%, a difference of 0.29%), Ecuadorian (1.1%, a difference of 0.49%), Assyrian/Chaldean/Syriac (1.1%, a difference of 0.52%), and Immigrants from Bolivia (1.1%, a difference of 0.60%).
| Demographics | Rating | Rank | Disability Age Under 5 |
| Immigrants | Sweden | 99.8 /100 | #47 | Exceptional 1.1% |
| Immigrants | Singapore | 99.7 /100 | #48 | Exceptional 1.1% |
| Immigrants | Russia | 99.7 /100 | #49 | Exceptional 1.1% |
| Immigrants | Japan | 99.7 /100 | #50 | Exceptional 1.1% |
| Immigrants | Kazakhstan | 99.7 /100 | #51 | Exceptional 1.1% |
| Immigrants | Bolivia | 99.6 /100 | #52 | Exceptional 1.1% |
| Asians | 99.6 /100 | #53 | Exceptional 1.1% |
| Immigrants | El Salvador | 99.6 /100 | #54 | Exceptional 1.1% |
| Salvadorans | 99.5 /100 | #55 | Exceptional 1.1% |
| Ecuadorians | 99.5 /100 | #56 | Exceptional 1.1% |
| Assyrians/Chaldeans/Syriacs | 99.5 /100 | #57 | Exceptional 1.1% |
| Immigrants | Egypt | 99.4 /100 | #58 | Exceptional 1.1% |
| Immigrants | Malaysia | 99.4 /100 | #59 | Exceptional 1.1% |
| Immigrants | Western Asia | 99.2 /100 | #60 | Exceptional 1.1% |
| Immigrants | Ethiopia | 99.2 /100 | #61 | Exceptional 1.1% |