Macedonian vs Immigrants from El Salvador Disability Age Under 5
COMPARE
Macedonian
Immigrants from El Salvador
Disability Age Under 5
Disability Age Under 5 Comparison
Macedonians
Immigrants from El Salvador
1.2%
DISABILITY AGE UNDER 5
43.7/ 100
METRIC RATING
181st/ 347
METRIC RANK
1.1%
DISABILITY AGE UNDER 5
99.6/ 100
METRIC RATING
54th/ 347
METRIC RANK
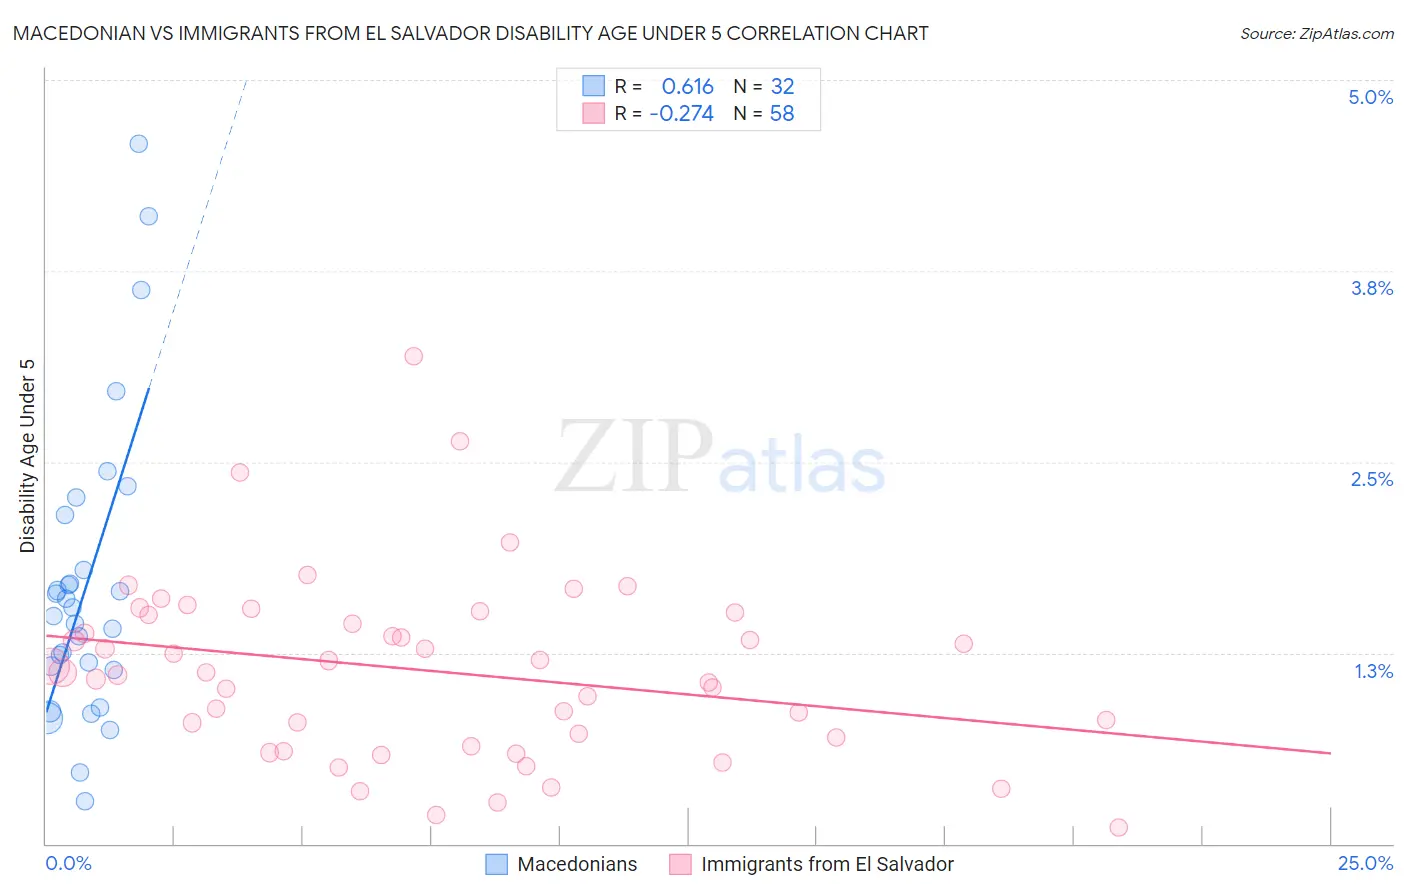
Macedonian vs Immigrants from El Salvador Disability Age Under 5 Correlation Chart
The statistical analysis conducted on geographies consisting of 91,108,284 people shows a significant positive correlation between the proportion of Macedonians and percentage of population with a disability under the age of 5 in the United States with a correlation coefficient (R) of 0.616 and weighted average of 1.2%. Similarly, the statistical analysis conducted on geographies consisting of 204,380,401 people shows a weak negative correlation between the proportion of Immigrants from El Salvador and percentage of population with a disability under the age of 5 in the United States with a correlation coefficient (R) of -0.274 and weighted average of 1.1%, a difference of 14.6%.
Disability Age Under 5 Correlation Summary
| Measurement | Macedonian | Immigrants from El Salvador |
| Minimum | 0.28% | 0.10% |
| Maximum | 4.6% | 3.2% |
| Range | 4.3% | 3.1% |
| Mean | 1.7% | 1.1% |
| Median | 1.5% | 1.1% |
| Interquartile 25% (IQ1) | 1.1% | 0.70% |
| Interquartile 75% (IQ3) | 2.0% | 1.5% |
| Interquartile Range (IQR) | 0.82% | 0.80% |
| Standard Deviation (Sample) | 0.98% | 0.59% |
| Standard Deviation (Population) | 0.97% | 0.58% |
Similar Demographics by Disability Age Under 5
Demographics Similar to Macedonians by Disability Age Under 5
In terms of disability age under 5, the demographic groups most similar to Macedonians are Immigrants from Peru (1.2%, a difference of 0.0%), Immigrants from Saudi Arabia (1.2%, a difference of 0.040%), Palestinian (1.2%, a difference of 0.060%), Immigrants from Mexico (1.2%, a difference of 0.070%), and Immigrants from Western Africa (1.2%, a difference of 0.11%).
| Demographics | Rating | Rank | Disability Age Under 5 |
| Immigrants | Latvia | 50.0 /100 | #174 | Average 1.2% |
| Immigrants | Nigeria | 50.0 /100 | #175 | Average 1.2% |
| Immigrants | Kenya | 48.6 /100 | #176 | Average 1.2% |
| Comanche | 47.5 /100 | #177 | Average 1.2% |
| Venezuelans | 47.1 /100 | #178 | Average 1.2% |
| Immigrants | Bahamas | 45.2 /100 | #179 | Average 1.2% |
| Immigrants | Mexico | 44.4 /100 | #180 | Average 1.2% |
| Immigrants | Peru | 43.7 /100 | #181 | Average 1.2% |
| Macedonians | 43.7 /100 | #181 | Average 1.2% |
| Immigrants | Saudi Arabia | 43.3 /100 | #183 | Average 1.2% |
| Palestinians | 43.0 /100 | #184 | Average 1.2% |
| Immigrants | Western Africa | 42.5 /100 | #185 | Average 1.2% |
| Cubans | 42.5 /100 | #186 | Average 1.2% |
| Immigrants | Haiti | 40.2 /100 | #187 | Average 1.3% |
| Haitians | 39.9 /100 | #188 | Fair 1.3% |
Demographics Similar to Immigrants from El Salvador by Disability Age Under 5
In terms of disability age under 5, the demographic groups most similar to Immigrants from El Salvador are Salvadoran (1.1%, a difference of 0.090%), Asian (1.1%, a difference of 0.29%), Ecuadorian (1.1%, a difference of 0.49%), Assyrian/Chaldean/Syriac (1.1%, a difference of 0.52%), and Immigrants from Bolivia (1.1%, a difference of 0.60%).
| Demographics | Rating | Rank | Disability Age Under 5 |
| Immigrants | Sweden | 99.8 /100 | #47 | Exceptional 1.1% |
| Immigrants | Singapore | 99.7 /100 | #48 | Exceptional 1.1% |
| Immigrants | Russia | 99.7 /100 | #49 | Exceptional 1.1% |
| Immigrants | Japan | 99.7 /100 | #50 | Exceptional 1.1% |
| Immigrants | Kazakhstan | 99.7 /100 | #51 | Exceptional 1.1% |
| Immigrants | Bolivia | 99.6 /100 | #52 | Exceptional 1.1% |
| Asians | 99.6 /100 | #53 | Exceptional 1.1% |
| Immigrants | El Salvador | 99.6 /100 | #54 | Exceptional 1.1% |
| Salvadorans | 99.5 /100 | #55 | Exceptional 1.1% |
| Ecuadorians | 99.5 /100 | #56 | Exceptional 1.1% |
| Assyrians/Chaldeans/Syriacs | 99.5 /100 | #57 | Exceptional 1.1% |
| Immigrants | Egypt | 99.4 /100 | #58 | Exceptional 1.1% |
| Immigrants | Malaysia | 99.4 /100 | #59 | Exceptional 1.1% |
| Immigrants | Western Asia | 99.2 /100 | #60 | Exceptional 1.1% |
| Immigrants | Ethiopia | 99.2 /100 | #61 | Exceptional 1.1% |