Guyanese vs Hungarian Disability Age 35 to 64
COMPARE
Guyanese
Hungarian
Disability Age 35 to 64
Disability Age 35 to 64 Comparison
Guyanese
Hungarians
11.0%
DISABILITY AGE 35 TO 64
75.1/ 100
METRIC RATING
157th/ 347
METRIC RANK
11.4%
DISABILITY AGE 35 TO 64
34.6/ 100
METRIC RATING
189th/ 347
METRIC RANK
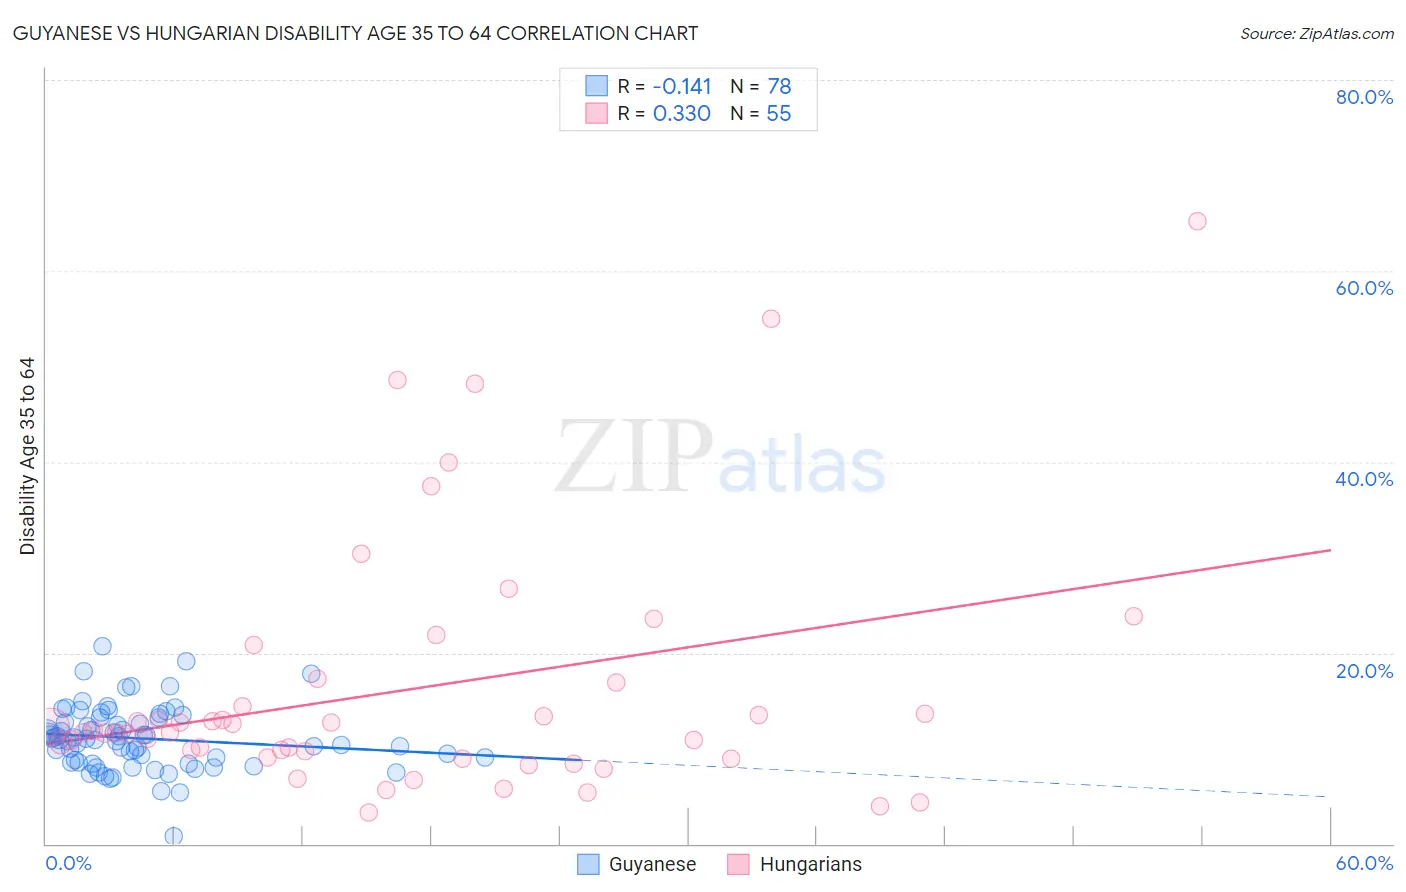
Guyanese vs Hungarian Disability Age 35 to 64 Correlation Chart
The statistical analysis conducted on geographies consisting of 176,764,315 people shows a poor negative correlation between the proportion of Guyanese and percentage of population with a disability between the ages 34 and 64 in the United States with a correlation coefficient (R) of -0.141 and weighted average of 11.0%. Similarly, the statistical analysis conducted on geographies consisting of 485,731,393 people shows a mild positive correlation between the proportion of Hungarians and percentage of population with a disability between the ages 34 and 64 in the United States with a correlation coefficient (R) of 0.330 and weighted average of 11.4%, a difference of 3.6%.
Disability Age 35 to 64 Correlation Summary
| Measurement | Guyanese | Hungarian |
| Minimum | 0.73% | 3.3% |
| Maximum | 20.7% | 65.2% |
| Range | 19.9% | 61.9% |
| Mean | 11.0% | 16.1% |
| Median | 10.9% | 11.7% |
| Interquartile 25% (IQ1) | 8.5% | 9.0% |
| Interquartile 75% (IQ3) | 13.3% | 16.9% |
| Interquartile Range (IQR) | 4.8% | 7.9% |
| Standard Deviation (Sample) | 3.3% | 13.2% |
| Standard Deviation (Population) | 3.3% | 13.0% |
Similar Demographics by Disability Age 35 to 64
Demographics Similar to Guyanese by Disability Age 35 to 64
In terms of disability age 35 to 64, the demographic groups most similar to Guyanese are Immigrants from North America (11.0%, a difference of 0.010%), Immigrants from Sierra Leone (11.0%, a difference of 0.13%), Moroccan (11.0%, a difference of 0.15%), Serbian (11.0%, a difference of 0.16%), and Immigrants from Canada (11.0%, a difference of 0.19%).
| Demographics | Rating | Rank | Disability Age 35 to 64 |
| Syrians | 79.8 /100 | #150 | Good 11.0% |
| New Zealanders | 79.3 /100 | #151 | Good 11.0% |
| Ukrainians | 78.0 /100 | #152 | Good 11.0% |
| Immigrants | England | 77.4 /100 | #153 | Good 11.0% |
| Immigrants | Canada | 76.7 /100 | #154 | Good 11.0% |
| Moroccans | 76.4 /100 | #155 | Good 11.0% |
| Immigrants | Sierra Leone | 76.2 /100 | #156 | Good 11.0% |
| Guyanese | 75.1 /100 | #157 | Good 11.0% |
| Immigrants | North America | 74.9 /100 | #158 | Good 11.0% |
| Serbians | 73.6 /100 | #159 | Good 11.0% |
| Croatians | 73.1 /100 | #160 | Good 11.0% |
| Immigrants | Guyana | 70.1 /100 | #161 | Good 11.1% |
| Immigrants | Grenada | 68.4 /100 | #162 | Good 11.1% |
| Immigrants | St. Vincent and the Grenadines | 66.6 /100 | #163 | Good 11.1% |
| Pakistanis | 65.8 /100 | #164 | Good 11.1% |
Demographics Similar to Hungarians by Disability Age 35 to 64
In terms of disability age 35 to 64, the demographic groups most similar to Hungarians are Northern European (11.4%, a difference of 0.020%), Immigrants from Bosnia and Herzegovina (11.4%, a difference of 0.050%), Slovene (11.4%, a difference of 0.17%), Danish (11.4%, a difference of 0.19%), and Immigrants from Nigeria (11.4%, a difference of 0.19%).
| Demographics | Rating | Rank | Disability Age 35 to 64 |
| Icelanders | 39.7 /100 | #182 | Fair 11.4% |
| Immigrants | Oceania | 39.5 /100 | #183 | Fair 11.4% |
| Kenyans | 39.2 /100 | #184 | Fair 11.4% |
| Danes | 36.8 /100 | #185 | Fair 11.4% |
| Slovenes | 36.6 /100 | #186 | Fair 11.4% |
| Immigrants | Bosnia and Herzegovina | 35.2 /100 | #187 | Fair 11.4% |
| Northern Europeans | 34.9 /100 | #188 | Fair 11.4% |
| Hungarians | 34.6 /100 | #189 | Fair 11.4% |
| Immigrants | Nigeria | 32.5 /100 | #190 | Fair 11.4% |
| Swedes | 31.3 /100 | #191 | Fair 11.4% |
| Norwegians | 29.7 /100 | #192 | Fair 11.5% |
| Immigrants | Africa | 29.0 /100 | #193 | Fair 11.5% |
| Immigrants | Latin America | 27.5 /100 | #194 | Fair 11.5% |
| Carpatho Rusyns | 25.3 /100 | #195 | Fair 11.5% |
| Iraqis | 24.2 /100 | #196 | Fair 11.5% |