Afghan vs Hungarian Disability Age 35 to 64

COMPARE

Afghan
Race
Ancestry
AfghanAfricanAlaska NativeAlaskan AthabascanAlbanianAleutAlsatianAmericanApacheArabArapahoArgentineanArmenianAssyrian/Chaldean/SyriacAustralianAustrianBahamianBangladeshiBarbadianBasqueBelgianBelizeanBermudanBhutaneseBlackfeetBolivianBrazilianBritishBritish West IndianBulgarianBurmeseCajunCambodianCanadianCape VerdeanCarpatho RusynCelticCentral AmericanCentral American IndianCherokeeCheyenneChickasawChileanChineseChippewaChoctawColombianColvilleComancheCosta RicanCreeCreekCroatianCrowCubanCypriotCzechCzechoslovakianDanishDelawareDominicanDutchDutch West IndianEastern EuropeanEcuadorianEgyptianEnglishEstonianEthiopianEuropeanFijianFilipinoFinnishFrenchFrench American IndianFrench CanadianGermanGerman RussianGhanaianGreekGuamanian/ChamorroGuatemalanGuyaneseHaitianHmongHonduranHopiHoumaIcelanderIndian (Asian)IndonesianInupiatIranianIraqiIrishIroquoisIsraeliItalianJamaicanJapaneseJordanianKenyanKiowaKoreanLaotianLatvianLebaneseLiberianLithuanianLumbeeLuxembourgerMacedonianMalaysianMalteseMarshalleseMenomineeMexicanMexican American IndianMongolianMoroccanNative HawaiianNavajoNepaleseNew ZealanderNicaraguanNigerianNorthern EuropeanNorwegianOkinawanOsageOttawaPaiutePakistaniPalestinianPanamanianParaguayanPennsylvania GermanPeruvianPimaPolishPortuguesePotawatomiPuebloPuerto RicanPuget Sound SalishRomanianRussianSalvadoranSamoanScandinavianScotch-IrishScottishSeminoleSenegaleseSerbianShoshoneSierra LeoneanSiouxSlavicSlovakSloveneSomaliSouth AfricanSouth AmericanSouth American IndianSoviet UnionSpaniardSpanishSpanish AmericanSpanish American IndianSri LankanSubsaharan AfricanSudaneseSwedishSwissSyrianTaiwaneseThaiTlingit-HaidaTohono O'OdhamTonganTrinidadian and TobagonianTsimshianTurkishU.S. Virgin IslanderUgandanUkrainianUruguayanUteVenezuelanVietnameseWelshWest IndianYakamaYaquiYugoslavianYumanYup'ikZimbabwean
Immigration
NonimmigrantsImmigrantsAfghanistanAfricaAlbaniaArgentinaArmeniaAsiaAustraliaAustriaBahamasBangladeshBarbadosBelarusBelgiumBelizeBoliviaBosnia and HerzegovinaBrazilBulgariaBurma/MyanmarCabo VerdeCambodiaCameroonCanadaCaribbeanCentral AmericaChileChinaColombiaCongoCosta RicaCroatiaCubaCzechoslovakiaDenmarkDominicaDominican RepublicEastern AfricaEastern AsiaEastern EuropeEcuadorEgyptEl SalvadorEnglandEritreaEthiopiaEuropeFijiFranceGermanyGhanaGreeceGrenadaGuatemalaGuyanaHaitiHondurasHong KongHungaryIndiaIndonesiaIranIraqIrelandIsraelItalyJamaicaJapanJordanKazakhstanKenyaKoreaKuwaitLaosLatin AmericaLatviaLebanonLiberiaLithuaniaMalaysiaMexicoMicronesiaMiddle AfricaMoldovaMoroccoNepalNetherlandsNicaraguaNigeriaNorth AmericaNorth MacedoniaNorthern AfricaNorthern EuropeNorwayOceaniaPakistanPanamaPeruPhilippinesPolandPortugalRomaniaRussiaSaudi ArabiaScotlandSenegalSerbiaSierra LeoneSingaporeSomaliaSouth AfricaSouth AmericaSouth Central AsiaSouth Eastern AsiaSouthern EuropeSpainSri LankaSt. Vincent and the GrenadinesSudanSwedenSwitzerlandSyriaTaiwanThailandTrinidad and TobagoTurkeyUgandaUkraineUruguayUzbekistanVenezuelaVietnamWest IndiesWestern AfricaWestern AsiaWestern EuropeYemenZaireZimbabweAzores
Hungarian
Race
Ancestry
AfricanAlaska NativeAlaskan AthabascanAlbanianAleutAlsatianAmericanApacheArabArapahoArgentineanArmenianAssyrian/Chaldean/SyriacAustralianAustrianBahamianBangladeshiBarbadianBasqueBelgianBelizeanBermudanBhutaneseBlackfeetBolivianBrazilianBritishBritish West IndianBulgarianBurmeseCajunCambodianCanadianCape VerdeanCarpatho RusynCelticCentral AmericanCentral American IndianCherokeeCheyenneChickasawChileanChineseChippewaChoctawColombianColvilleComancheCosta RicanCreeCreekCroatianCrowCubanCypriotCzechCzechoslovakianDanishDelawareDominicanDutchDutch West IndianEastern EuropeanEcuadorianEgyptianEnglishEstonianEthiopianEuropeanFijianFilipinoFinnishFrenchFrench American IndianFrench CanadianGermanGerman RussianGhanaianGreekGuamanian/ChamorroGuatemalanGuyaneseHaitianHmongHonduranHopiHoumaHungarianIcelanderIndian (Asian)IndonesianInupiatIranianIraqiIrishIroquoisIsraeliItalianJamaicanJapaneseJordanianKenyanKiowaKoreanLaotianLatvianLebaneseLiberianLithuanianLumbeeLuxembourgerMacedonianMalaysianMalteseMarshalleseMenomineeMexicanMexican American IndianMongolianMoroccanNative HawaiianNavajoNepaleseNew ZealanderNicaraguanNigerianNorthern EuropeanNorwegianOkinawanOsageOttawaPaiutePakistaniPalestinianPanamanianParaguayanPennsylvania GermanPeruvianPimaPolishPortuguesePotawatomiPuebloPuerto RicanPuget Sound SalishRomanianRussianSalvadoranSamoanScandinavianScotch-IrishScottishSeminoleSenegaleseSerbianShoshoneSierra LeoneanSiouxSlavicSlovakSloveneSomaliSouth AfricanSouth AmericanSouth American IndianSoviet UnionSpaniardSpanishSpanish AmericanSpanish American IndianSri LankanSubsaharan AfricanSudaneseSwedishSwissSyrianTaiwaneseThaiTlingit-HaidaTohono O'OdhamTonganTrinidadian and TobagonianTsimshianTurkishU.S. Virgin IslanderUgandanUkrainianUruguayanUteVenezuelanVietnameseWelshWest IndianYakamaYaquiYugoslavianYumanYup'ikZimbabwean
Immigration
NonimmigrantsImmigrantsAfghanistanAfricaAlbaniaArgentinaArmeniaAsiaAustraliaAustriaBahamasBangladeshBarbadosBelarusBelgiumBelizeBoliviaBosnia and HerzegovinaBrazilBulgariaBurma/MyanmarCabo VerdeCambodiaCameroonCanadaCaribbeanCentral AmericaChileChinaColombiaCongoCosta RicaCroatiaCubaCzechoslovakiaDenmarkDominicaDominican RepublicEastern AfricaEastern AsiaEastern EuropeEcuadorEgyptEl SalvadorEnglandEritreaEthiopiaEuropeFijiFranceGermanyGhanaGreeceGrenadaGuatemalaGuyanaHaitiHondurasHong KongHungaryIndiaIndonesiaIranIraqIrelandIsraelItalyJamaicaJapanJordanKazakhstanKenyaKoreaKuwaitLaosLatin AmericaLatviaLebanonLiberiaLithuaniaMalaysiaMexicoMicronesiaMiddle AfricaMoldovaMoroccoNepalNetherlandsNicaraguaNigeriaNorth AmericaNorth MacedoniaNorthern AfricaNorthern EuropeNorwayOceaniaPakistanPanamaPeruPhilippinesPolandPortugalRomaniaRussiaSaudi ArabiaScotlandSenegalSerbiaSierra LeoneSingaporeSomaliaSouth AfricaSouth AmericaSouth Central AsiaSouth Eastern AsiaSouthern EuropeSpainSri LankaSt. Vincent and the GrenadinesSudanSwedenSwitzerlandSyriaTaiwanThailandTrinidad and TobagoTurkeyUgandaUkraineUruguayUzbekistanVenezuelaVietnamWest IndiesWestern AfricaWestern AsiaWestern EuropeYemenZaireZimbabweAzores
Disability Age 35 to 64
Income
Poverty
Unemployment
Labor Participation
Family Structure
Vehicle Availability
Education Level
Disability

Disability Age 35 to 64 Comparison

Afghans

Hungarians

Exceptional
Fair
10.3%
DISABILITY AGE 35 TO 64
98.9/ 100
METRIC RATING
90th/ 347
METRIC RANK
11.4%
DISABILITY AGE 35 TO 64
34.6/ 100
METRIC RATING
189th/ 347
METRIC RANK

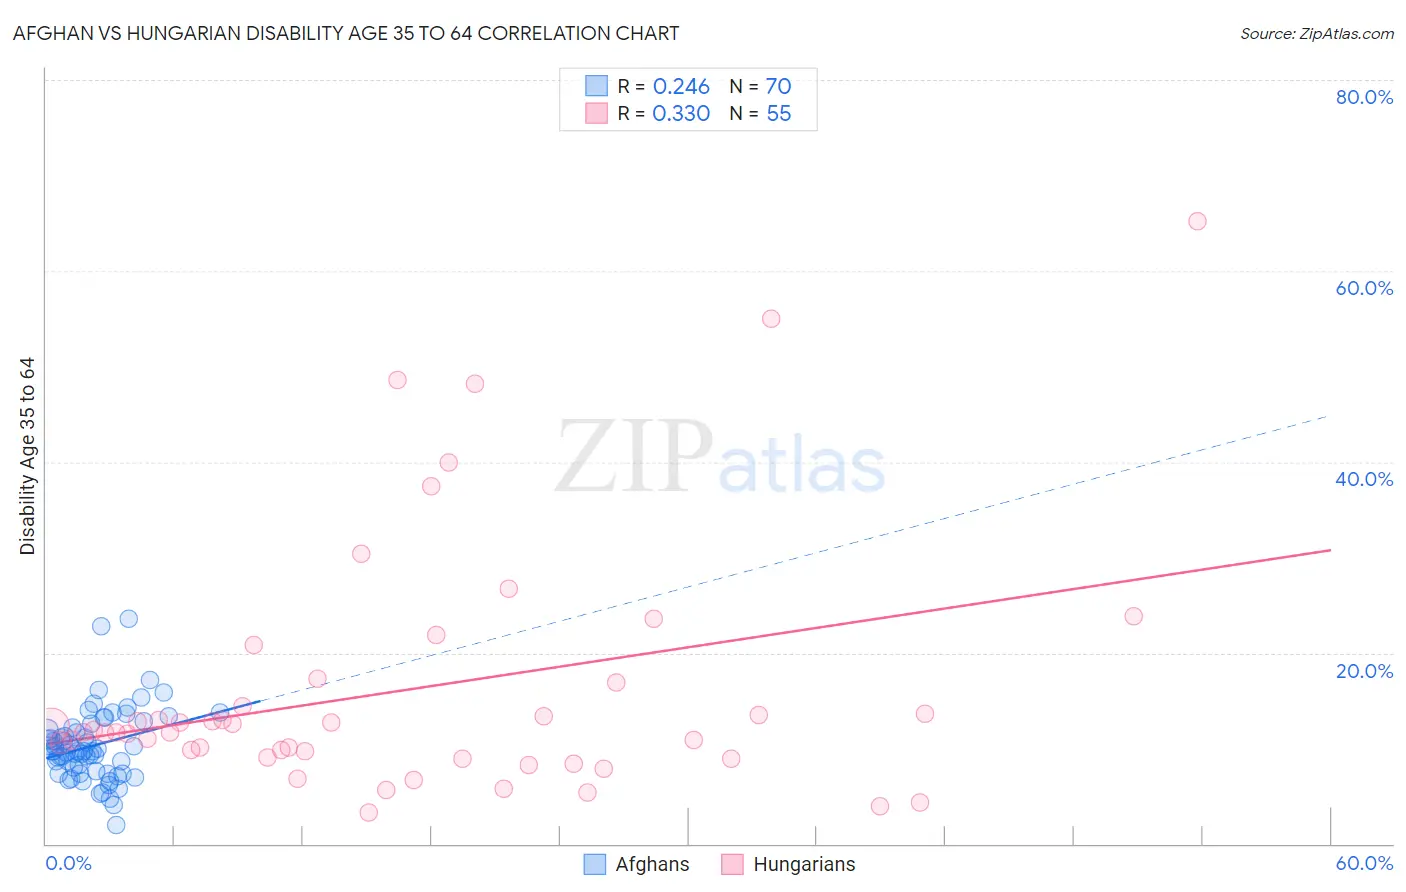
Afghan vs Hungarian Disability Age 35 to 64 Correlation Chart

The statistical analysis conducted on geographies consisting of 148,816,709 people shows a weak positive correlation between the proportion of Afghans and percentage of population with a disability between the ages 34 and 64 in the United States with a correlation coefficient (R) of 0.246 and weighted average of 10.3%. Similarly, the statistical analysis conducted on geographies consisting of 485,731,393 people shows a mild positive correlation between the proportion of Hungarians and percentage of population with a disability between the ages 34 and 64 in the United States with a correlation coefficient (R) of 0.330 and weighted average of 11.4%, a difference of 11.4%.
Afghan vs Hungarian Disability Age 35 to 64

Disability Age 35 to 64 Correlation Summary

MeasurementAfghanHungarian
Minimum2.0%3.3%
Maximum23.5%65.2%
Range21.5%61.9%
Mean10.3%16.1%
Median9.7%11.7%
Interquartile 25% (IQ1)7.5%9.0%
Interquartile 75% (IQ3)12.2%16.9%
Interquartile Range (IQR)4.7%7.9%
Standard Deviation (Sample)3.8%13.2%
Standard Deviation (Population)3.7%13.0%

Similar Demographics by Disability Age 35 to 64

Demographics Similar to Afghans by Disability Age 35 to 64

In terms of disability age 35 to 64, the demographic groups most similar to Afghans are Immigrants from Lebanon (10.3%, a difference of 0.010%), Uruguayan (10.2%, a difference of 0.11%), Chilean (10.2%, a difference of 0.12%), Immigrants from Northern Africa (10.3%, a difference of 0.33%), and Immigrants from Europe (10.2%, a difference of 0.36%).
DemographicsRating | RankDisability Age 35 to 64
Immigrants | Brazil
99.2
/100
|
#83
Exceptional
10.2%
Sri Lankans
99.2
/100
|
#84
Exceptional
10.2%
Immigrants | Kuwait
99.1
/100
|
#85
Exceptional
10.2%
Immigrants | Europe
99.1
/100
|
#86
Exceptional
10.2%
Nicaraguans
99.1
/100
|
#87
Exceptional
10.2%
Chileans
99.0
/100
|
#88
Exceptional
10.2%
Uruguayans
99.0
/100
|
#89
Exceptional
10.2%
Afghans
98.9
/100
|
#90
Exceptional
10.3%
Immigrants | Lebanon
98.9
/100
|
#91
Exceptional
10.3%
Immigrants | Northern Africa
98.7
/100
|
#92
Exceptional
10.3%
Immigrants | North Macedonia
98.7
/100
|
#93
Exceptional
10.3%
Immigrants | Italy
98.7
/100
|
#94
Exceptional
10.3%
Chinese
98.7
/100
|
#95
Exceptional
10.3%
Immigrants | South Africa
98.5
/100
|
#96
Exceptional
10.3%
Immigrants | Denmark
98.4
/100
|
#97
Exceptional
10.3%

Demographics Similar to Hungarians by Disability Age 35 to 64

In terms of disability age 35 to 64, the demographic groups most similar to Hungarians are Northern European (11.4%, a difference of 0.020%), Immigrants from Bosnia and Herzegovina (11.4%, a difference of 0.050%), Slovene (11.4%, a difference of 0.17%), Danish (11.4%, a difference of 0.19%), and Immigrants from Nigeria (11.4%, a difference of 0.19%).
DemographicsRating | RankDisability Age 35 to 64
Icelanders
39.7
/100
|
#182
Fair
11.4%
Immigrants | Oceania
39.5
/100
|
#183
Fair
11.4%
Kenyans
39.2
/100
|
#184
Fair
11.4%
Danes
36.8
/100
|
#185
Fair
11.4%
Slovenes
36.6
/100
|
#186
Fair
11.4%
Immigrants | Bosnia and Herzegovina
35.2
/100
|
#187
Fair
11.4%
Northern Europeans
34.9
/100
|
#188
Fair
11.4%
Hungarians
34.6
/100
|
#189
Fair
11.4%
Immigrants | Nigeria
32.5
/100
|
#190
Fair
11.4%
Swedes
31.3
/100
|
#191
Fair
11.4%
Norwegians
29.7
/100
|
#192
Fair
11.5%
Immigrants | Africa
29.0
/100
|
#193
Fair
11.5%
Immigrants | Latin America
27.5
/100
|
#194
Fair
11.5%
Carpatho Rusyns
25.3
/100
|
#195
Fair
11.5%
Iraqis
24.2
/100
|
#196
Fair
11.5%