Guyanese vs Immigrants from Fiji Disability Age 35 to 64
COMPARE
Guyanese
Immigrants from Fiji
Disability Age 35 to 64
Disability Age 35 to 64 Comparison
Guyanese
Immigrants from Fiji
11.0%
DISABILITY AGE 35 TO 64
75.1/ 100
METRIC RATING
157th/ 347
METRIC RANK
11.3%
DISABILITY AGE 35 TO 64
50.0/ 100
METRIC RATING
174th/ 347
METRIC RANK
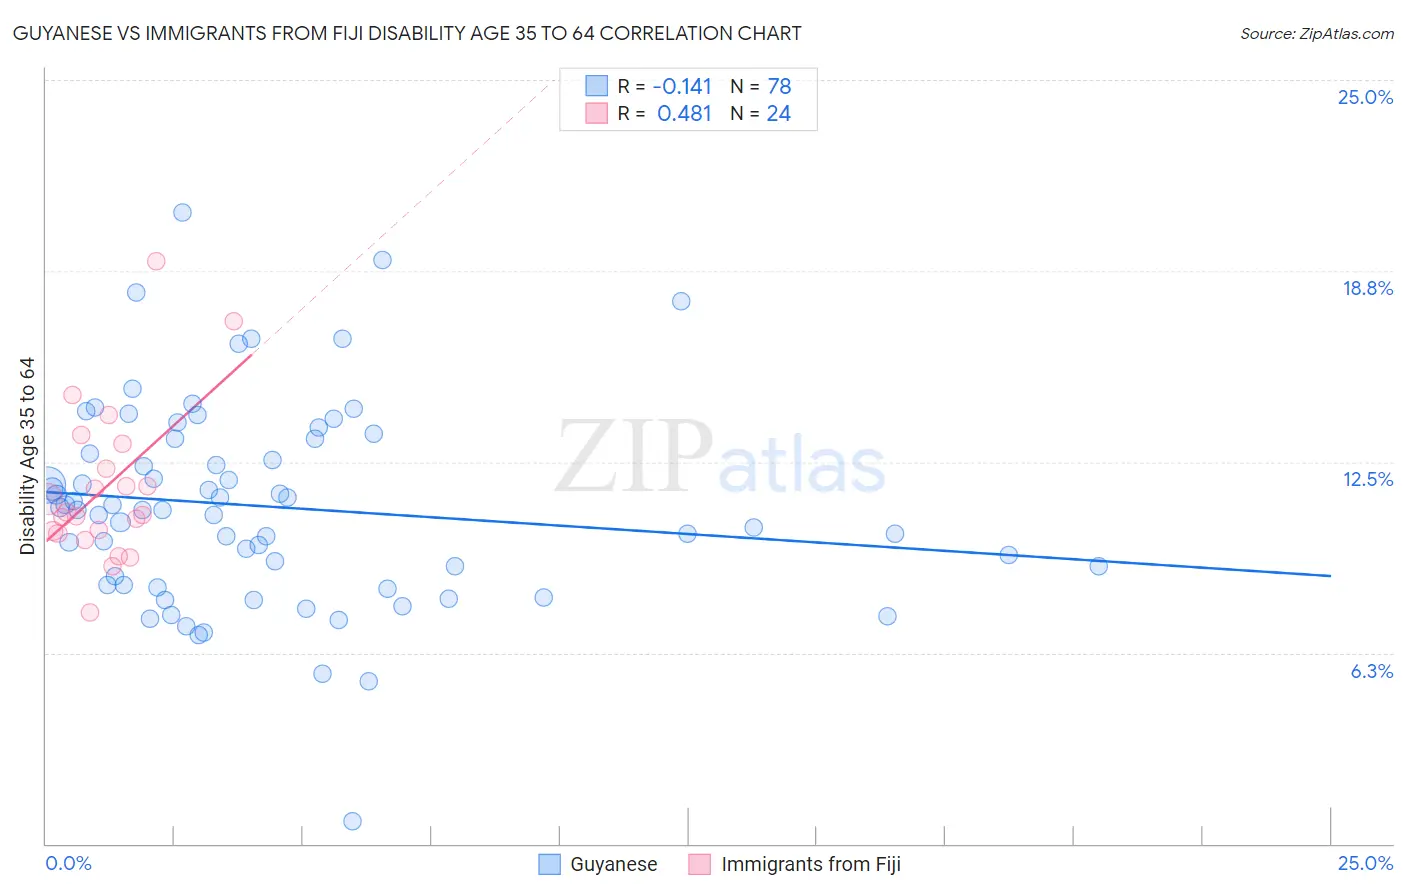
Guyanese vs Immigrants from Fiji Disability Age 35 to 64 Correlation Chart
The statistical analysis conducted on geographies consisting of 176,764,315 people shows a poor negative correlation between the proportion of Guyanese and percentage of population with a disability between the ages 34 and 64 in the United States with a correlation coefficient (R) of -0.141 and weighted average of 11.0%. Similarly, the statistical analysis conducted on geographies consisting of 93,753,522 people shows a moderate positive correlation between the proportion of Immigrants from Fiji and percentage of population with a disability between the ages 34 and 64 in the United States with a correlation coefficient (R) of 0.481 and weighted average of 11.3%, a difference of 2.3%.
Disability Age 35 to 64 Correlation Summary
| Measurement | Guyanese | Immigrants from Fiji |
| Minimum | 0.73% | 7.6% |
| Maximum | 20.7% | 19.1% |
| Range | 19.9% | 11.5% |
| Mean | 11.0% | 11.7% |
| Median | 10.9% | 10.8% |
| Interquartile 25% (IQ1) | 8.5% | 10.2% |
| Interquartile 75% (IQ3) | 13.3% | 12.7% |
| Interquartile Range (IQR) | 4.8% | 2.5% |
| Standard Deviation (Sample) | 3.3% | 2.6% |
| Standard Deviation (Population) | 3.3% | 2.5% |
Demographics Similar to Guyanese and Immigrants from Fiji by Disability Age 35 to 64
In terms of disability age 35 to 64, the demographic groups most similar to Guyanese are Immigrants from North America (11.0%, a difference of 0.010%), Immigrants from Sierra Leone (11.0%, a difference of 0.13%), Moroccan (11.0%, a difference of 0.15%), Serbian (11.0%, a difference of 0.16%), and Croatian (11.0%, a difference of 0.21%). Similarly, the demographic groups most similar to Immigrants from Fiji are Lebanese (11.3%, a difference of 0.14%), Czech (11.3%, a difference of 0.17%), Italian (11.2%, a difference of 0.46%), Immigrants from Trinidad and Tobago (11.2%, a difference of 0.48%), and Immigrants from Uganda (11.2%, a difference of 0.65%).
| Demographics | Rating | Rank | Disability Age 35 to 64 |
| Moroccans | 76.4 /100 | #155 | Good 11.0% |
| Immigrants | Sierra Leone | 76.2 /100 | #156 | Good 11.0% |
| Guyanese | 75.1 /100 | #157 | Good 11.0% |
| Immigrants | North America | 74.9 /100 | #158 | Good 11.0% |
| Serbians | 73.6 /100 | #159 | Good 11.0% |
| Croatians | 73.1 /100 | #160 | Good 11.0% |
| Immigrants | Guyana | 70.1 /100 | #161 | Good 11.1% |
| Immigrants | Grenada | 68.4 /100 | #162 | Good 11.1% |
| Immigrants | St. Vincent and the Grenadines | 66.6 /100 | #163 | Good 11.1% |
| Pakistanis | 65.8 /100 | #164 | Good 11.1% |
| Immigrants | Western Europe | 65.2 /100 | #165 | Good 11.1% |
| Immigrants | Haiti | 63.8 /100 | #166 | Good 11.1% |
| Austrians | 63.2 /100 | #167 | Good 11.1% |
| Central Americans | 59.1 /100 | #168 | Average 11.2% |
| Haitians | 59.0 /100 | #169 | Average 11.2% |
| Immigrants | Uganda | 58.0 /100 | #170 | Average 11.2% |
| Immigrants | Trinidad and Tobago | 55.9 /100 | #171 | Average 11.2% |
| Italians | 55.6 /100 | #172 | Average 11.2% |
| Lebanese | 51.8 /100 | #173 | Average 11.3% |
| Immigrants | Fiji | 50.0 /100 | #174 | Average 11.3% |
| Czechs | 47.9 /100 | #175 | Average 11.3% |