Guyanese vs Immigrants from Sierra Leone Disability Age 35 to 64
COMPARE
Guyanese
Immigrants from Sierra Leone
Disability Age 35 to 64
Disability Age 35 to 64 Comparison
Guyanese
Immigrants from Sierra Leone
11.0%
DISABILITY AGE 35 TO 64
75.1/ 100
METRIC RATING
157th/ 347
METRIC RANK
11.0%
DISABILITY AGE 35 TO 64
76.2/ 100
METRIC RATING
156th/ 347
METRIC RANK
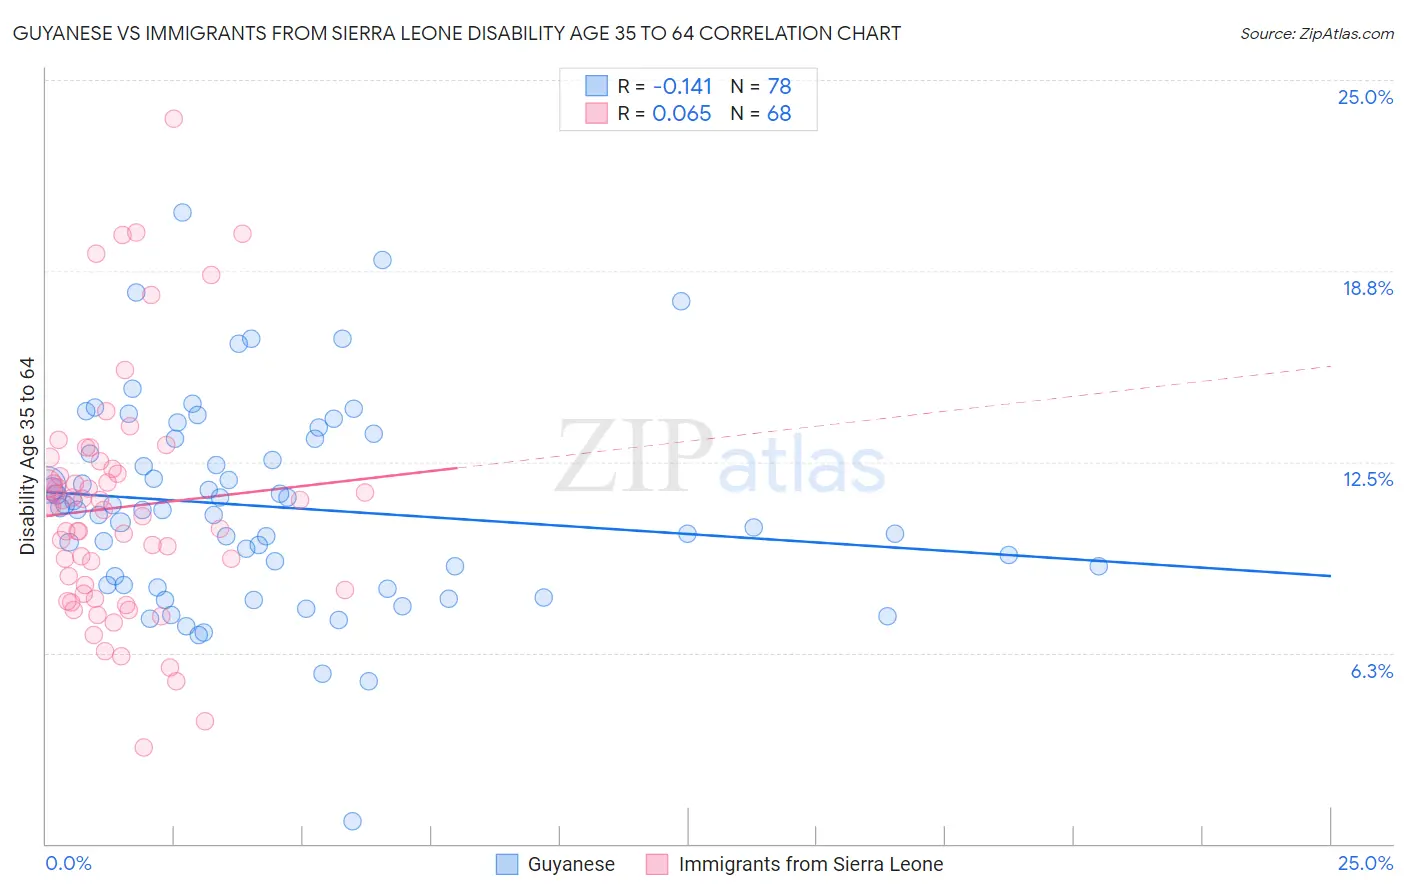
Guyanese vs Immigrants from Sierra Leone Disability Age 35 to 64 Correlation Chart
The statistical analysis conducted on geographies consisting of 176,764,315 people shows a poor negative correlation between the proportion of Guyanese and percentage of population with a disability between the ages 34 and 64 in the United States with a correlation coefficient (R) of -0.141 and weighted average of 11.0%. Similarly, the statistical analysis conducted on geographies consisting of 101,638,803 people shows a slight positive correlation between the proportion of Immigrants from Sierra Leone and percentage of population with a disability between the ages 34 and 64 in the United States with a correlation coefficient (R) of 0.065 and weighted average of 11.0%, a difference of 0.13%.
Disability Age 35 to 64 Correlation Summary
| Measurement | Guyanese | Immigrants from Sierra Leone |
| Minimum | 0.73% | 3.2% |
| Maximum | 20.7% | 23.8% |
| Range | 19.9% | 20.6% |
| Mean | 11.0% | 11.0% |
| Median | 10.9% | 11.0% |
| Interquartile 25% (IQ1) | 8.5% | 8.3% |
| Interquartile 75% (IQ3) | 13.3% | 12.2% |
| Interquartile Range (IQR) | 4.8% | 3.9% |
| Standard Deviation (Sample) | 3.3% | 3.9% |
| Standard Deviation (Population) | 3.3% | 3.9% |
Demographics Similar to Guyanese and Immigrants from Sierra Leone by Disability Age 35 to 64
In terms of disability age 35 to 64, the demographic groups most similar to Guyanese are Immigrants from North America (11.0%, a difference of 0.010%), Moroccan (11.0%, a difference of 0.15%), Serbian (11.0%, a difference of 0.16%), Immigrants from Canada (11.0%, a difference of 0.19%), and Croatian (11.0%, a difference of 0.21%). Similarly, the demographic groups most similar to Immigrants from Sierra Leone are Moroccan (11.0%, a difference of 0.020%), Immigrants from Canada (11.0%, a difference of 0.060%), Immigrants from England (11.0%, a difference of 0.13%), Immigrants from North America (11.0%, a difference of 0.14%), and Ukrainian (11.0%, a difference of 0.21%).
| Demographics | Rating | Rank | Disability Age 35 to 64 |
| South American Indians | 83.5 /100 | #146 | Excellent 10.9% |
| Immigrants | Eritrea | 83.4 /100 | #147 | Excellent 10.9% |
| Arabs | 82.7 /100 | #148 | Excellent 10.9% |
| Immigrants | Cameroon | 81.1 /100 | #149 | Excellent 10.9% |
| Syrians | 79.8 /100 | #150 | Good 11.0% |
| New Zealanders | 79.3 /100 | #151 | Good 11.0% |
| Ukrainians | 78.0 /100 | #152 | Good 11.0% |
| Immigrants | England | 77.4 /100 | #153 | Good 11.0% |
| Immigrants | Canada | 76.7 /100 | #154 | Good 11.0% |
| Moroccans | 76.4 /100 | #155 | Good 11.0% |
| Immigrants | Sierra Leone | 76.2 /100 | #156 | Good 11.0% |
| Guyanese | 75.1 /100 | #157 | Good 11.0% |
| Immigrants | North America | 74.9 /100 | #158 | Good 11.0% |
| Serbians | 73.6 /100 | #159 | Good 11.0% |
| Croatians | 73.1 /100 | #160 | Good 11.0% |
| Immigrants | Guyana | 70.1 /100 | #161 | Good 11.1% |
| Immigrants | Grenada | 68.4 /100 | #162 | Good 11.1% |
| Immigrants | St. Vincent and the Grenadines | 66.6 /100 | #163 | Good 11.1% |
| Pakistanis | 65.8 /100 | #164 | Good 11.1% |
| Immigrants | Western Europe | 65.2 /100 | #165 | Good 11.1% |
| Immigrants | Haiti | 63.8 /100 | #166 | Good 11.1% |