Apache vs Hungarian Disability Age 35 to 64
COMPARE
Apache
Hungarian
Disability Age 35 to 64
Disability Age 35 to 64 Comparison
Apache
Hungarians
14.9%
DISABILITY AGE 35 TO 64
0.0/ 100
METRIC RATING
323rd/ 347
METRIC RANK
11.4%
DISABILITY AGE 35 TO 64
34.6/ 100
METRIC RATING
189th/ 347
METRIC RANK
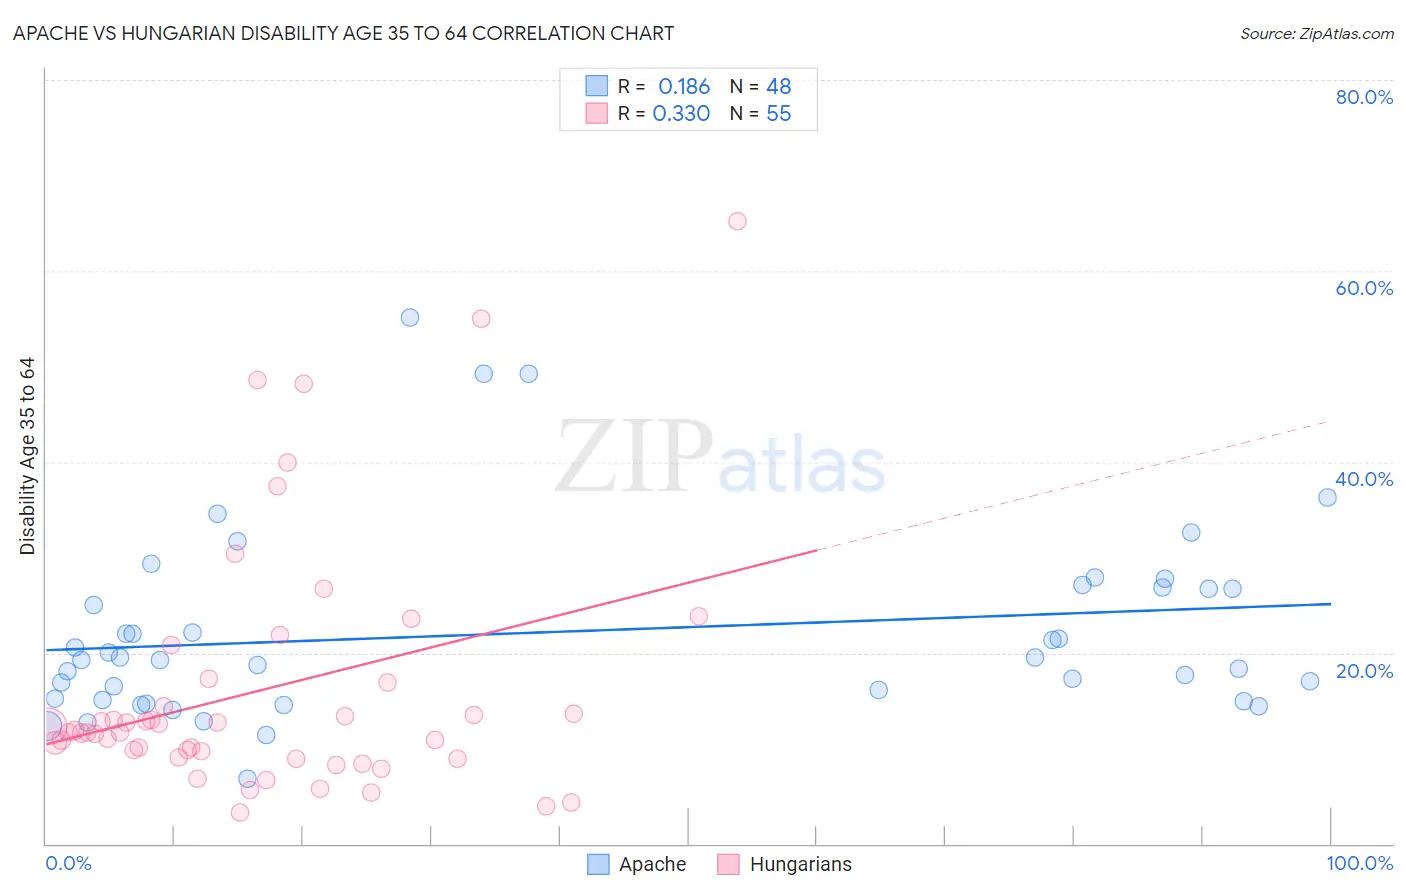
Apache vs Hungarian Disability Age 35 to 64 Correlation Chart
The statistical analysis conducted on geographies consisting of 231,024,095 people shows a poor positive correlation between the proportion of Apache and percentage of population with a disability between the ages 34 and 64 in the United States with a correlation coefficient (R) of 0.186 and weighted average of 14.9%. Similarly, the statistical analysis conducted on geographies consisting of 485,731,393 people shows a mild positive correlation between the proportion of Hungarians and percentage of population with a disability between the ages 34 and 64 in the United States with a correlation coefficient (R) of 0.330 and weighted average of 11.4%, a difference of 30.8%.
Disability Age 35 to 64 Correlation Summary
| Measurement | Apache | Hungarian |
| Minimum | 6.9% | 3.3% |
| Maximum | 55.2% | 65.2% |
| Range | 48.3% | 61.9% |
| Mean | 22.1% | 16.1% |
| Median | 19.4% | 11.7% |
| Interquartile 25% (IQ1) | 15.1% | 9.0% |
| Interquartile 75% (IQ3) | 26.8% | 16.9% |
| Interquartile Range (IQR) | 11.7% | 7.9% |
| Standard Deviation (Sample) | 9.9% | 13.2% |
| Standard Deviation (Population) | 9.8% | 13.0% |
Similar Demographics by Disability Age 35 to 64
Demographics Similar to Apache by Disability Age 35 to 64
In terms of disability age 35 to 64, the demographic groups most similar to Apache are Chippewa (15.0%, a difference of 0.20%), Arapaho (15.1%, a difference of 0.87%), Potawatomi (14.8%, a difference of 1.2%), Comanche (14.7%, a difference of 1.3%), and Black/African American (14.7%, a difference of 1.5%).
| Demographics | Rating | Rank | Disability Age 35 to 64 |
| Osage | 0.0 /100 | #316 | Tragic 14.5% |
| Crow | 0.0 /100 | #317 | Tragic 14.6% |
| Ottawa | 0.0 /100 | #318 | Tragic 14.6% |
| Immigrants | Cabo Verde | 0.0 /100 | #319 | Tragic 14.7% |
| Blacks/African Americans | 0.0 /100 | #320 | Tragic 14.7% |
| Comanche | 0.0 /100 | #321 | Tragic 14.7% |
| Potawatomi | 0.0 /100 | #322 | Tragic 14.8% |
| Apache | 0.0 /100 | #323 | Tragic 14.9% |
| Chippewa | 0.0 /100 | #324 | Tragic 15.0% |
| Arapaho | 0.0 /100 | #325 | Tragic 15.1% |
| Natives/Alaskans | 0.0 /100 | #326 | Tragic 15.3% |
| Pueblo | 0.0 /100 | #327 | Tragic 15.3% |
| Cajuns | 0.0 /100 | #328 | Tragic 15.3% |
| Cherokee | 0.0 /100 | #329 | Tragic 15.5% |
| Navajo | 0.0 /100 | #330 | Tragic 15.5% |
Demographics Similar to Hungarians by Disability Age 35 to 64
In terms of disability age 35 to 64, the demographic groups most similar to Hungarians are Northern European (11.4%, a difference of 0.020%), Immigrants from Bosnia and Herzegovina (11.4%, a difference of 0.050%), Slovene (11.4%, a difference of 0.17%), Danish (11.4%, a difference of 0.19%), and Immigrants from Nigeria (11.4%, a difference of 0.19%).
| Demographics | Rating | Rank | Disability Age 35 to 64 |
| Icelanders | 39.7 /100 | #182 | Fair 11.4% |
| Immigrants | Oceania | 39.5 /100 | #183 | Fair 11.4% |
| Kenyans | 39.2 /100 | #184 | Fair 11.4% |
| Danes | 36.8 /100 | #185 | Fair 11.4% |
| Slovenes | 36.6 /100 | #186 | Fair 11.4% |
| Immigrants | Bosnia and Herzegovina | 35.2 /100 | #187 | Fair 11.4% |
| Northern Europeans | 34.9 /100 | #188 | Fair 11.4% |
| Hungarians | 34.6 /100 | #189 | Fair 11.4% |
| Immigrants | Nigeria | 32.5 /100 | #190 | Fair 11.4% |
| Swedes | 31.3 /100 | #191 | Fair 11.4% |
| Norwegians | 29.7 /100 | #192 | Fair 11.5% |
| Immigrants | Africa | 29.0 /100 | #193 | Fair 11.5% |
| Immigrants | Latin America | 27.5 /100 | #194 | Fair 11.5% |
| Carpatho Rusyns | 25.3 /100 | #195 | Fair 11.5% |
| Iraqis | 24.2 /100 | #196 | Fair 11.5% |