Guyanese vs South American Female Disability
COMPARE
Guyanese
South American
Female Disability
Female Disability Comparison
Guyanese
South Americans
12.1%
FEMALE DISABILITY
64.7/ 100
METRIC RATING
161st/ 347
METRIC RANK
11.4%
FEMALE DISABILITY
99.9/ 100
METRIC RATING
57th/ 347
METRIC RANK
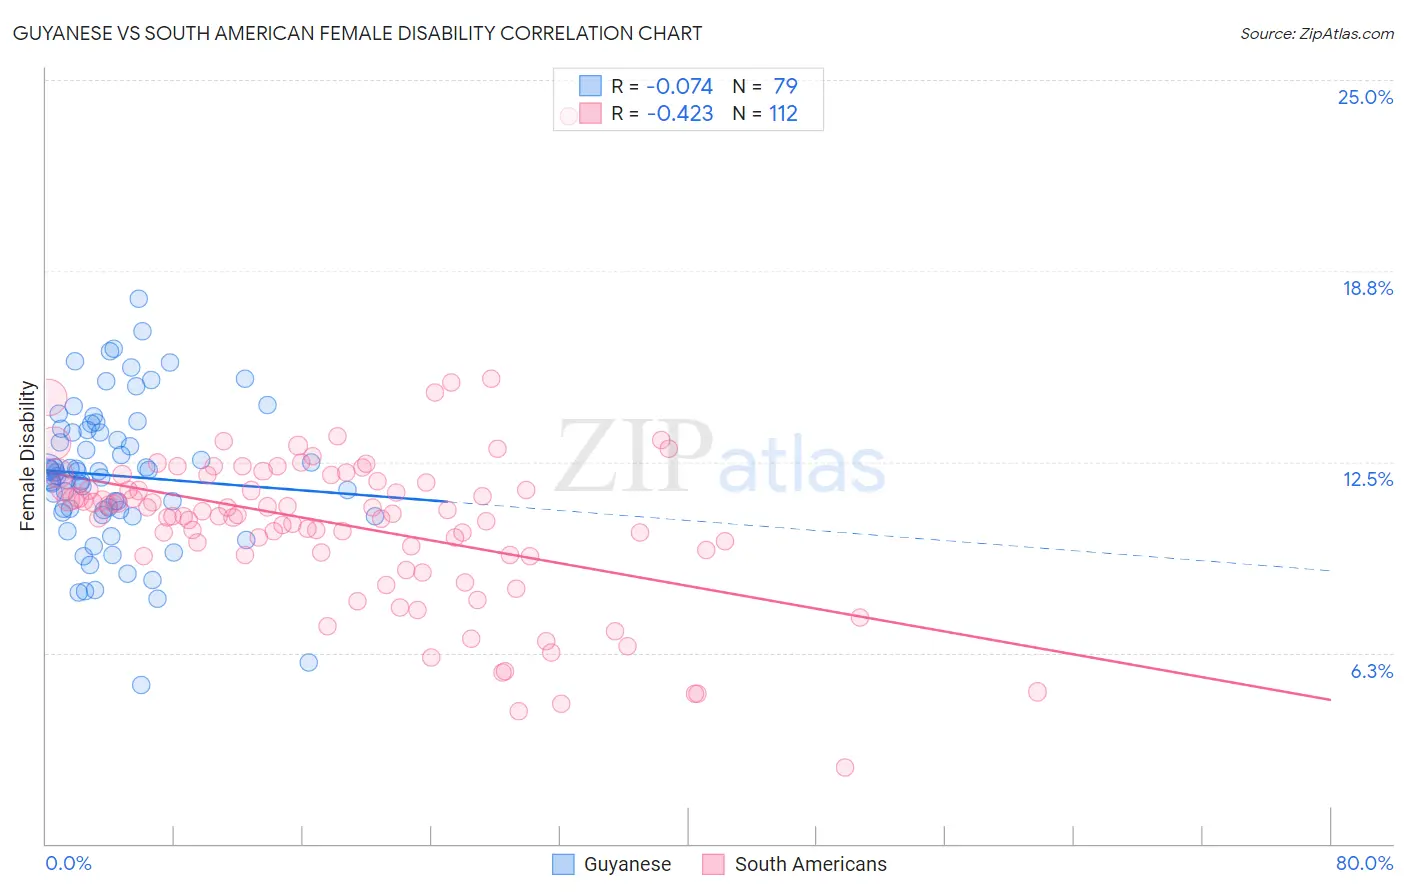
Guyanese vs South American Female Disability Correlation Chart
The statistical analysis conducted on geographies consisting of 176,903,596 people shows a slight negative correlation between the proportion of Guyanese and percentage of females with a disability in the United States with a correlation coefficient (R) of -0.074 and weighted average of 12.1%. Similarly, the statistical analysis conducted on geographies consisting of 494,047,696 people shows a moderate negative correlation between the proportion of South Americans and percentage of females with a disability in the United States with a correlation coefficient (R) of -0.423 and weighted average of 11.4%, a difference of 6.6%.
Female Disability Correlation Summary
| Measurement | Guyanese | South American |
| Minimum | 5.2% | 2.5% |
| Maximum | 17.8% | 23.8% |
| Range | 12.6% | 21.3% |
| Mean | 12.0% | 10.4% |
| Median | 12.2% | 10.8% |
| Interquartile 25% (IQ1) | 10.8% | 9.5% |
| Interquartile 75% (IQ3) | 13.5% | 11.9% |
| Interquartile Range (IQR) | 2.7% | 2.4% |
| Standard Deviation (Sample) | 2.4% | 2.7% |
| Standard Deviation (Population) | 2.4% | 2.7% |
Similar Demographics by Female Disability
Demographics Similar to Guyanese by Female Disability
In terms of female disability, the demographic groups most similar to Guyanese are Immigrants from Ukraine (12.1%, a difference of 0.010%), Guatemalan (12.1%, a difference of 0.030%), Czech (12.1%, a difference of 0.040%), Immigrants from Guatemala (12.1%, a difference of 0.060%), and Immigrants from Oceania (12.1%, a difference of 0.11%).
| Demographics | Rating | Rank | Female Disability |
| Syrians | 76.9 /100 | #154 | Good 12.1% |
| Ghanaians | 76.6 /100 | #155 | Good 12.1% |
| Moroccans | 72.9 /100 | #156 | Good 12.1% |
| Danes | 72.5 /100 | #157 | Good 12.1% |
| Immigrants | Middle Africa | 72.4 /100 | #158 | Good 12.1% |
| Immigrants | Central America | 67.7 /100 | #159 | Good 12.1% |
| Immigrants | Guatemala | 66.0 /100 | #160 | Good 12.1% |
| Guyanese | 64.7 /100 | #161 | Good 12.1% |
| Immigrants | Ukraine | 64.3 /100 | #162 | Good 12.1% |
| Guatemalans | 63.8 /100 | #163 | Good 12.1% |
| Czechs | 63.6 /100 | #164 | Good 12.1% |
| Immigrants | Oceania | 61.8 /100 | #165 | Good 12.1% |
| Lithuanians | 59.5 /100 | #166 | Average 12.2% |
| Immigrants | Latin America | 59.0 /100 | #167 | Average 12.2% |
| Immigrants | Haiti | 58.8 /100 | #168 | Average 12.2% |
Demographics Similar to South Americans by Female Disability
In terms of female disability, the demographic groups most similar to South Americans are Laotian (11.4%, a difference of 0.020%), Taiwanese (11.4%, a difference of 0.080%), Immigrants from Spain (11.4%, a difference of 0.15%), Immigrants from Bulgaria (11.4%, a difference of 0.27%), and Bulgarian (11.3%, a difference of 0.31%).
| Demographics | Rating | Rank | Female Disability |
| Inupiat | 100.0 /100 | #50 | Exceptional 11.3% |
| Immigrants | Belgium | 100.0 /100 | #51 | Exceptional 11.3% |
| Immigrants | Peru | 99.9 /100 | #52 | Exceptional 11.3% |
| Immigrants | Saudi Arabia | 99.9 /100 | #53 | Exceptional 11.3% |
| Peruvians | 99.9 /100 | #54 | Exceptional 11.3% |
| Bulgarians | 99.9 /100 | #55 | Exceptional 11.3% |
| Taiwanese | 99.9 /100 | #56 | Exceptional 11.4% |
| South Americans | 99.9 /100 | #57 | Exceptional 11.4% |
| Laotians | 99.9 /100 | #58 | Exceptional 11.4% |
| Immigrants | Spain | 99.9 /100 | #59 | Exceptional 11.4% |
| Immigrants | Bulgaria | 99.9 /100 | #60 | Exceptional 11.4% |
| Immigrants | France | 99.9 /100 | #61 | Exceptional 11.4% |
| Sri Lankans | 99.9 /100 | #62 | Exceptional 11.4% |
| Immigrants | Colombia | 99.9 /100 | #63 | Exceptional 11.4% |
| Immigrants | El Salvador | 99.9 /100 | #64 | Exceptional 11.4% |