Guyanese vs Cheyenne Unemployment Among Ages 25 to 29 years
COMPARE
Guyanese
Cheyenne
Unemployment Among Ages 25 to 29 years
Unemployment Among Ages 25 to 29 years Comparison
Guyanese
Cheyenne
8.5%
UNEMPLOYMENT AMONG AGES 25 TO 29 YEARS
0.0/ 100
METRIC RATING
318th/ 347
METRIC RANK
11.8%
UNEMPLOYMENT AMONG AGES 25 TO 29 YEARS
0.0/ 100
METRIC RATING
340th/ 347
METRIC RANK
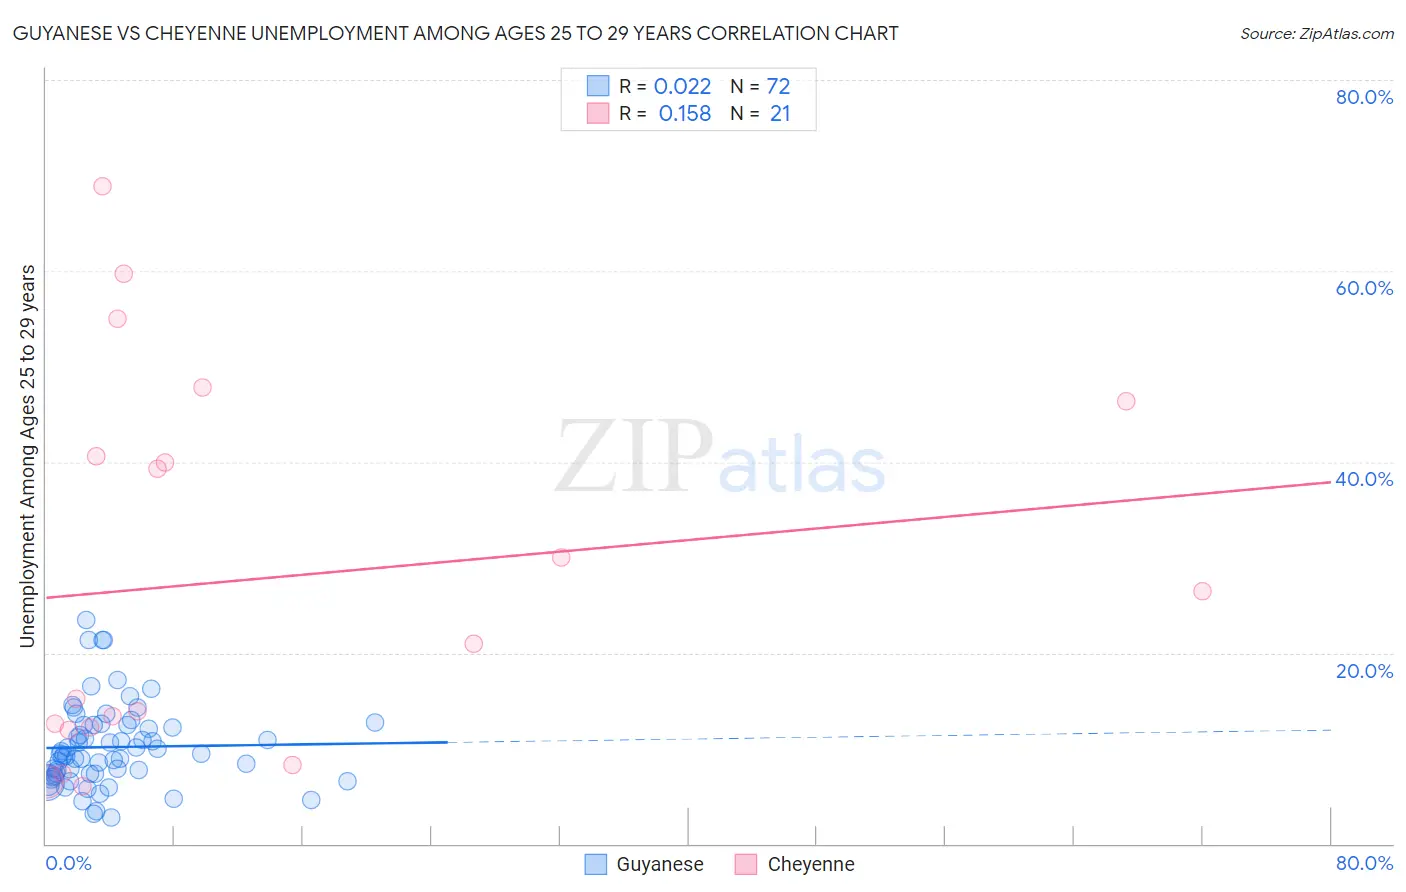
Guyanese vs Cheyenne Unemployment Among Ages 25 to 29 years Correlation Chart
The statistical analysis conducted on geographies consisting of 172,955,672 people shows no correlation between the proportion of Guyanese and unemployment rate among population between the ages 25 and 29 in the United States with a correlation coefficient (R) of 0.022 and weighted average of 8.5%. Similarly, the statistical analysis conducted on geographies consisting of 79,166,796 people shows a poor positive correlation between the proportion of Cheyenne and unemployment rate among population between the ages 25 and 29 in the United States with a correlation coefficient (R) of 0.158 and weighted average of 11.8%, a difference of 39.5%.
Unemployment Among Ages 25 to 29 years Correlation Summary
| Measurement | Guyanese | Cheyenne |
| Minimum | 2.8% | 6.0% |
| Maximum | 23.4% | 68.9% |
| Range | 20.6% | 62.9% |
| Mean | 10.1% | 27.7% |
| Median | 9.4% | 20.9% |
| Interquartile 25% (IQ1) | 7.3% | 12.1% |
| Interquartile 75% (IQ3) | 12.5% | 43.5% |
| Interquartile Range (IQR) | 5.2% | 31.4% |
| Standard Deviation (Sample) | 4.3% | 19.6% |
| Standard Deviation (Population) | 4.3% | 19.2% |
Similar Demographics by Unemployment Among Ages 25 to 29 years
Demographics Similar to Guyanese by Unemployment Among Ages 25 to 29 years
In terms of unemployment among ages 25 to 29 years, the demographic groups most similar to Guyanese are Immigrants from Armenia (8.5%, a difference of 0.23%), Immigrants from Guyana (8.5%, a difference of 0.26%), Immigrants from Grenada (8.4%, a difference of 0.35%), British West Indian (8.4%, a difference of 0.41%), and Black/African American (8.6%, a difference of 0.97%).
| Demographics | Rating | Rank | Unemployment Among Ages 25 to 29 years |
| Immigrants | Azores | 0.0 /100 | #311 | Tragic 8.1% |
| Dutch West Indians | 0.0 /100 | #312 | Tragic 8.2% |
| Immigrants | St. Vincent and the Grenadines | 0.0 /100 | #313 | Tragic 8.4% |
| Immigrants | Dominica | 0.0 /100 | #314 | Tragic 8.4% |
| British West Indians | 0.0 /100 | #315 | Tragic 8.4% |
| Immigrants | Grenada | 0.0 /100 | #316 | Tragic 8.4% |
| Immigrants | Guyana | 0.0 /100 | #317 | Tragic 8.5% |
| Guyanese | 0.0 /100 | #318 | Tragic 8.5% |
| Immigrants | Armenia | 0.0 /100 | #319 | Tragic 8.5% |
| Blacks/African Americans | 0.0 /100 | #320 | Tragic 8.6% |
| Immigrants | Dominican Republic | 0.0 /100 | #321 | Tragic 8.6% |
| Tlingit-Haida | 0.0 /100 | #322 | Tragic 8.7% |
| Dominicans | 0.0 /100 | #323 | Tragic 8.7% |
| Houma | 0.0 /100 | #324 | Tragic 8.7% |
| Yakama | 0.0 /100 | #325 | Tragic 8.8% |
Demographics Similar to Cheyenne by Unemployment Among Ages 25 to 29 years
In terms of unemployment among ages 25 to 29 years, the demographic groups most similar to Cheyenne are Pima (11.8%, a difference of 0.42%), Sioux (11.7%, a difference of 1.4%), Tohono O'odham (12.1%, a difference of 2.1%), Navajo (12.2%, a difference of 2.9%), and Menominee (11.3%, a difference of 4.9%).
| Demographics | Rating | Rank | Unemployment Among Ages 25 to 29 years |
| Alaskan Athabascans | 0.0 /100 | #333 | Tragic 10.8% |
| Yuman | 0.0 /100 | #334 | Tragic 11.0% |
| Puerto Ricans | 0.0 /100 | #335 | Tragic 11.1% |
| Lumbee | 0.0 /100 | #336 | Tragic 11.2% |
| Menominee | 0.0 /100 | #337 | Tragic 11.3% |
| Sioux | 0.0 /100 | #338 | Tragic 11.7% |
| Pima | 0.0 /100 | #339 | Tragic 11.8% |
| Cheyenne | 0.0 /100 | #340 | Tragic 11.8% |
| Tohono O'odham | 0.0 /100 | #341 | Tragic 12.1% |
| Navajo | 0.0 /100 | #342 | Tragic 12.2% |
| Inupiat | 0.0 /100 | #343 | Tragic 13.4% |
| Hopi | 0.0 /100 | #344 | Tragic 13.5% |
| Arapaho | 0.0 /100 | #345 | Tragic 15.4% |
| Crow | 0.0 /100 | #346 | Tragic 15.4% |
| Yup'ik | 0.0 /100 | #347 | Tragic 17.9% |