Guatemalan vs Immigrants from Belarus Cognitive Disability
COMPARE
Guatemalan
Immigrants from Belarus
Cognitive Disability
Cognitive Disability Comparison
Guatemalans
Immigrants from Belarus
17.8%
COGNITIVE DISABILITY
2.1/ 100
METRIC RATING
231st/ 347
METRIC RANK
16.5%
COGNITIVE DISABILITY
99.9/ 100
METRIC RATING
40th/ 347
METRIC RANK
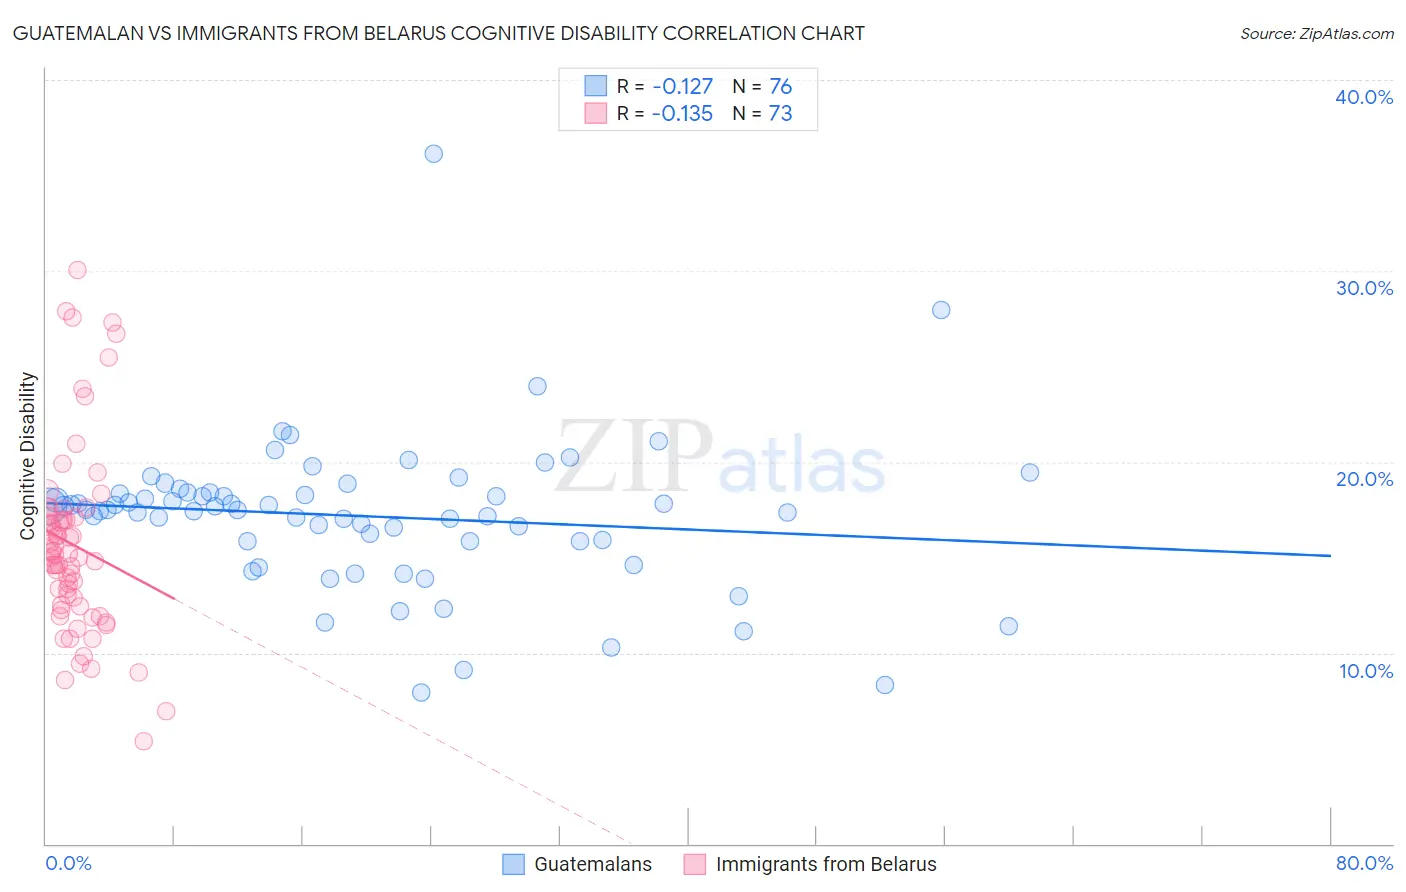
Guatemalan vs Immigrants from Belarus Cognitive Disability Correlation Chart
The statistical analysis conducted on geographies consisting of 409,490,798 people shows a poor negative correlation between the proportion of Guatemalans and percentage of population with cognitive disability in the United States with a correlation coefficient (R) of -0.127 and weighted average of 17.8%. Similarly, the statistical analysis conducted on geographies consisting of 150,194,359 people shows a poor negative correlation between the proportion of Immigrants from Belarus and percentage of population with cognitive disability in the United States with a correlation coefficient (R) of -0.135 and weighted average of 16.5%, a difference of 7.8%.
Cognitive Disability Correlation Summary
| Measurement | Guatemalan | Immigrants from Belarus |
| Minimum | 7.9% | 5.4% |
| Maximum | 36.1% | 30.1% |
| Range | 28.2% | 24.7% |
| Mean | 17.2% | 15.6% |
| Median | 17.5% | 15.1% |
| Interquartile 25% (IQ1) | 15.9% | 12.5% |
| Interquartile 75% (IQ3) | 18.4% | 17.1% |
| Interquartile Range (IQR) | 2.5% | 4.6% |
| Standard Deviation (Sample) | 3.9% | 4.9% |
| Standard Deviation (Population) | 3.9% | 4.9% |
Similar Demographics by Cognitive Disability
Demographics Similar to Guatemalans by Cognitive Disability
In terms of cognitive disability, the demographic groups most similar to Guatemalans are Tongan (17.8%, a difference of 0.0%), Panamanian (17.8%, a difference of 0.0%), Osage (17.8%, a difference of 0.020%), Spanish American Indian (17.8%, a difference of 0.020%), and Mongolian (17.7%, a difference of 0.030%).
| Demographics | Rating | Rank | Cognitive Disability |
| Fijians | 3.4 /100 | #224 | Tragic 17.7% |
| Vietnamese | 3.4 /100 | #225 | Tragic 17.7% |
| Marshallese | 2.7 /100 | #226 | Tragic 17.7% |
| Immigrants | St. Vincent and the Grenadines | 2.6 /100 | #227 | Tragic 17.7% |
| Immigrants | Central America | 2.3 /100 | #228 | Tragic 17.7% |
| Immigrants | Guatemala | 2.2 /100 | #229 | Tragic 17.7% |
| Mongolians | 2.2 /100 | #230 | Tragic 17.7% |
| Guatemalans | 2.1 /100 | #231 | Tragic 17.8% |
| Tongans | 2.1 /100 | #232 | Tragic 17.8% |
| Panamanians | 2.1 /100 | #233 | Tragic 17.8% |
| Osage | 2.0 /100 | #234 | Tragic 17.8% |
| Spanish American Indians | 2.0 /100 | #235 | Tragic 17.8% |
| Immigrants | Iraq | 1.8 /100 | #236 | Tragic 17.8% |
| Immigrants | Mexico | 1.8 /100 | #237 | Tragic 17.8% |
| Cheyenne | 1.7 /100 | #238 | Tragic 17.8% |
Demographics Similar to Immigrants from Belarus by Cognitive Disability
In terms of cognitive disability, the demographic groups most similar to Immigrants from Belarus are Cuban (16.5%, a difference of 0.0%), Bolivian (16.5%, a difference of 0.010%), Hungarian (16.5%, a difference of 0.020%), Immigrants from Canada (16.5%, a difference of 0.080%), and Immigrants from Eastern Europe (16.5%, a difference of 0.090%).
| Demographics | Rating | Rank | Cognitive Disability |
| Italians | 99.9 /100 | #33 | Exceptional 16.4% |
| Russians | 99.9 /100 | #34 | Exceptional 16.4% |
| Slovaks | 99.9 /100 | #35 | Exceptional 16.4% |
| Greeks | 99.9 /100 | #36 | Exceptional 16.4% |
| Slovenes | 99.9 /100 | #37 | Exceptional 16.5% |
| Immigrants | Eastern Europe | 99.9 /100 | #38 | Exceptional 16.5% |
| Bolivians | 99.9 /100 | #39 | Exceptional 16.5% |
| Immigrants | Belarus | 99.9 /100 | #40 | Exceptional 16.5% |
| Cubans | 99.9 /100 | #41 | Exceptional 16.5% |
| Hungarians | 99.9 /100 | #42 | Exceptional 16.5% |
| Immigrants | Canada | 99.8 /100 | #43 | Exceptional 16.5% |
| Macedonians | 99.8 /100 | #44 | Exceptional 16.5% |
| Immigrants | Europe | 99.8 /100 | #45 | Exceptional 16.5% |
| Immigrants | Colombia | 99.8 /100 | #46 | Exceptional 16.5% |
| Immigrants | Italy | 99.8 /100 | #47 | Exceptional 16.5% |