Guatemalan vs Immigrants from Portugal 5th Grade
COMPARE
Guatemalan
Immigrants from Portugal
5th Grade
5th Grade Comparison
Guatemalans
Immigrants from Portugal
94.8%
5TH GRADE
0.0/ 100
METRIC RATING
340th/ 347
METRIC RANK
95.9%
5TH GRADE
0.0/ 100
METRIC RATING
314th/ 347
METRIC RANK
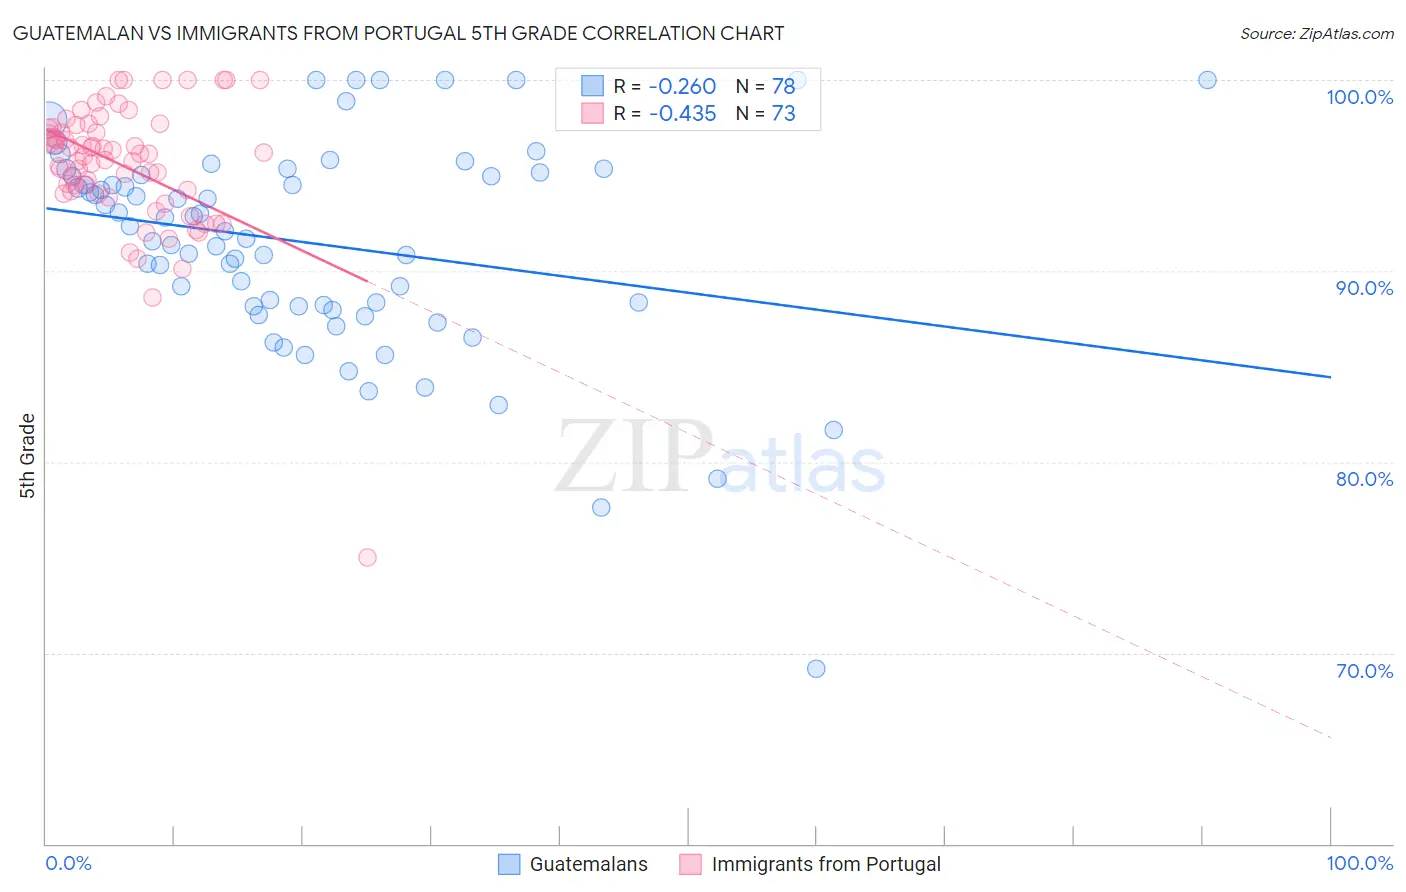
Guatemalan vs Immigrants from Portugal 5th Grade Correlation Chart
The statistical analysis conducted on geographies consisting of 409,566,469 people shows a weak negative correlation between the proportion of Guatemalans and percentage of population with at least 5th grade education in the United States with a correlation coefficient (R) of -0.260 and weighted average of 94.8%. Similarly, the statistical analysis conducted on geographies consisting of 174,792,107 people shows a moderate negative correlation between the proportion of Immigrants from Portugal and percentage of population with at least 5th grade education in the United States with a correlation coefficient (R) of -0.435 and weighted average of 95.9%, a difference of 1.1%.
5th Grade Correlation Summary
| Measurement | Guatemalan | Immigrants from Portugal |
| Minimum | 69.2% | 75.0% |
| Maximum | 100.0% | 100.0% |
| Range | 30.8% | 25.0% |
| Mean | 91.5% | 95.5% |
| Median | 92.2% | 96.1% |
| Interquartile 25% (IQ1) | 88.2% | 94.1% |
| Interquartile 75% (IQ3) | 95.0% | 97.5% |
| Interquartile Range (IQR) | 6.8% | 3.4% |
| Standard Deviation (Sample) | 5.6% | 3.5% |
| Standard Deviation (Population) | 5.6% | 3.5% |
Similar Demographics by 5th Grade
Demographics Similar to Guatemalans by 5th Grade
In terms of 5th grade, the demographic groups most similar to Guatemalans are Immigrants from Yemen (94.9%, a difference of 0.030%), Immigrants from Cabo Verde (94.9%, a difference of 0.070%), Yakama (94.8%, a difference of 0.080%), Immigrants from Central America (94.7%, a difference of 0.18%), and Central American (95.1%, a difference of 0.23%).
| Demographics | Rating | Rank | 5th Grade |
| Immigrants | Latin America | 0.0 /100 | #333 | Tragic 95.3% |
| Nepalese | 0.0 /100 | #334 | Tragic 95.2% |
| Mexicans | 0.0 /100 | #335 | Tragic 95.2% |
| Immigrants | Azores | 0.0 /100 | #336 | Tragic 95.1% |
| Central Americans | 0.0 /100 | #337 | Tragic 95.1% |
| Immigrants | Cabo Verde | 0.0 /100 | #338 | Tragic 94.9% |
| Immigrants | Yemen | 0.0 /100 | #339 | Tragic 94.9% |
| Guatemalans | 0.0 /100 | #340 | Tragic 94.8% |
| Yakama | 0.0 /100 | #341 | Tragic 94.8% |
| Immigrants | Central America | 0.0 /100 | #342 | Tragic 94.7% |
| Salvadorans | 0.0 /100 | #343 | Tragic 94.6% |
| Immigrants | Mexico | 0.0 /100 | #344 | Tragic 94.6% |
| Immigrants | Guatemala | 0.0 /100 | #345 | Tragic 94.6% |
| Immigrants | El Salvador | 0.0 /100 | #346 | Tragic 94.3% |
| Spanish American Indians | 0.0 /100 | #347 | Tragic 94.2% |
Demographics Similar to Immigrants from Portugal by 5th Grade
In terms of 5th grade, the demographic groups most similar to Immigrants from Portugal are Bangladeshi (95.9%, a difference of 0.0%), Vietnamese (95.9%, a difference of 0.020%), Nicaraguan (95.9%, a difference of 0.020%), Immigrants from Bangladesh (96.0%, a difference of 0.050%), and Indonesian (96.0%, a difference of 0.070%).
| Demographics | Rating | Rank | 5th Grade |
| Immigrants | Caribbean | 0.0 /100 | #307 | Tragic 96.0% |
| Ecuadorians | 0.0 /100 | #308 | Tragic 96.0% |
| Immigrants | Guyana | 0.0 /100 | #309 | Tragic 96.0% |
| Indonesians | 0.0 /100 | #310 | Tragic 96.0% |
| Immigrants | Bangladesh | 0.0 /100 | #311 | Tragic 96.0% |
| Vietnamese | 0.0 /100 | #312 | Tragic 95.9% |
| Bangladeshis | 0.0 /100 | #313 | Tragic 95.9% |
| Immigrants | Portugal | 0.0 /100 | #314 | Tragic 95.9% |
| Nicaraguans | 0.0 /100 | #315 | Tragic 95.9% |
| Immigrants | Ecuador | 0.0 /100 | #316 | Tragic 95.8% |
| Belizeans | 0.0 /100 | #317 | Tragic 95.8% |
| Immigrants | Vietnam | 0.0 /100 | #318 | Tragic 95.8% |
| Japanese | 0.0 /100 | #319 | Tragic 95.7% |
| Central American Indians | 0.0 /100 | #320 | Tragic 95.7% |
| Immigrants | Belize | 0.0 /100 | #321 | Tragic 95.7% |