Guatemalan vs Immigrants from Portugal Family Households with Children
COMPARE
Guatemalan
Immigrants from Portugal
Family Households with Children
Family Households with Children Comparison
Guatemalans
Immigrants from Portugal
28.9%
FAMILY HOUSEHOLDS WITH CHILDREN
100.0/ 100
METRIC RATING
52nd/ 347
METRIC RANK
27.7%
FAMILY HOUSEHOLDS WITH CHILDREN
84.1/ 100
METRIC RATING
136th/ 347
METRIC RANK
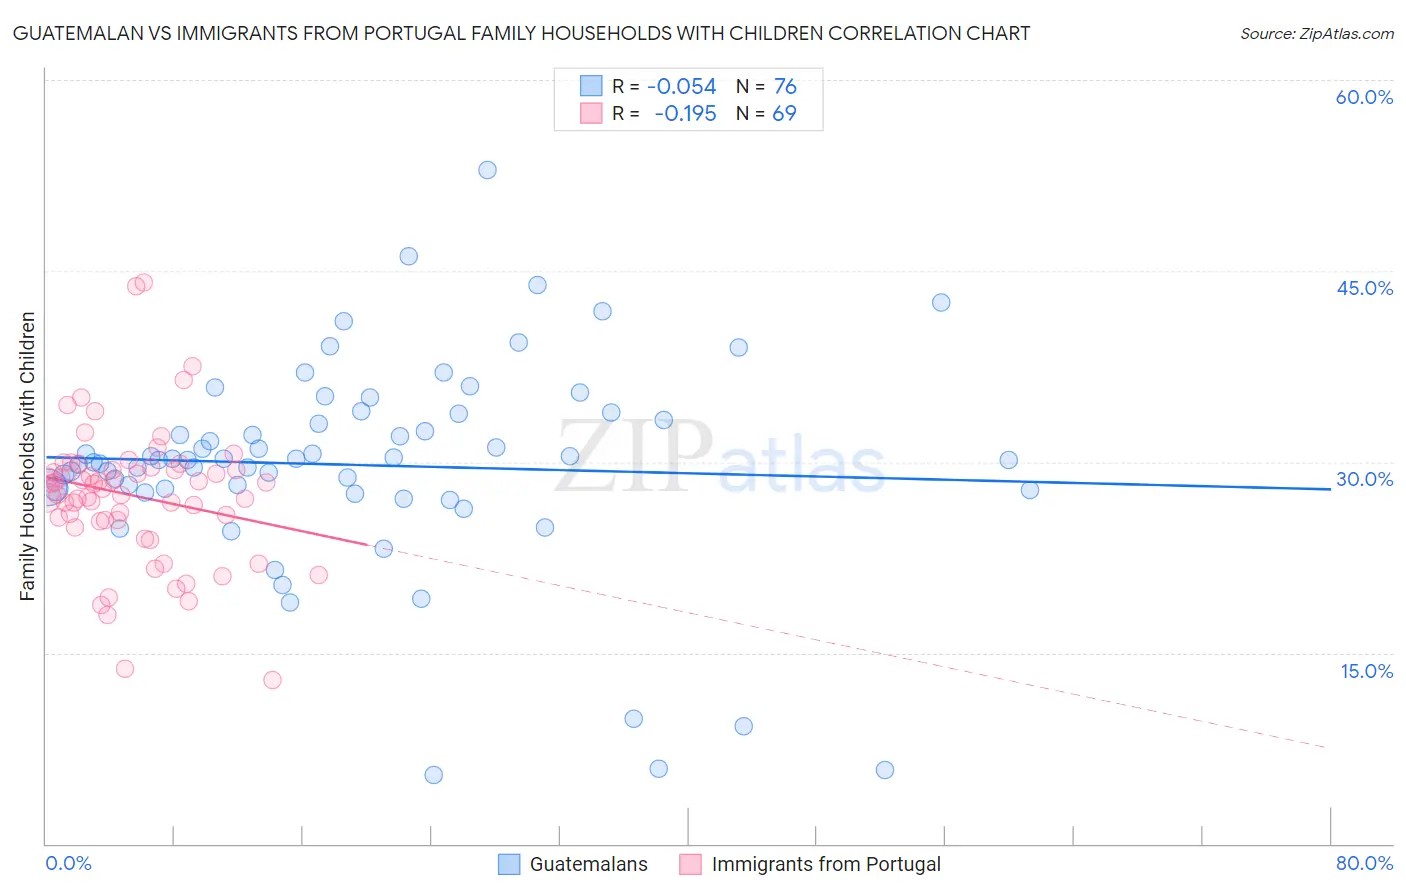
Guatemalan vs Immigrants from Portugal Family Households with Children Correlation Chart
The statistical analysis conducted on geographies consisting of 409,222,746 people shows a slight negative correlation between the proportion of Guatemalans and percentage of family households with children in the United States with a correlation coefficient (R) of -0.054 and weighted average of 28.9%. Similarly, the statistical analysis conducted on geographies consisting of 174,702,981 people shows a poor negative correlation between the proportion of Immigrants from Portugal and percentage of family households with children in the United States with a correlation coefficient (R) of -0.195 and weighted average of 27.7%, a difference of 4.3%.
Family Households with Children Correlation Summary
| Measurement | Guatemalan | Immigrants from Portugal |
| Minimum | 5.4% | 12.9% |
| Maximum | 52.9% | 44.1% |
| Range | 47.5% | 31.2% |
| Mean | 29.8% | 27.4% |
| Median | 30.1% | 27.9% |
| Interquartile 25% (IQ1) | 27.8% | 25.4% |
| Interquartile 75% (IQ3) | 33.5% | 29.5% |
| Interquartile Range (IQR) | 5.7% | 4.1% |
| Standard Deviation (Sample) | 8.3% | 5.5% |
| Standard Deviation (Population) | 8.3% | 5.4% |
Similar Demographics by Family Households with Children
Demographics Similar to Guatemalans by Family Households with Children
In terms of family households with children, the demographic groups most similar to Guatemalans are Immigrants from Cambodia (28.9%, a difference of 0.070%), Immigrants from Peru (28.9%, a difference of 0.080%), Immigrants (28.9%, a difference of 0.11%), Sierra Leonean (28.9%, a difference of 0.15%), and Immigrants from Asia (28.8%, a difference of 0.21%).
| Demographics | Rating | Rank | Family Households with Children |
| Fijians | 100.0 /100 | #45 | Exceptional 29.0% |
| Immigrants | Philippines | 100.0 /100 | #46 | Exceptional 29.0% |
| Peruvians | 100.0 /100 | #47 | Exceptional 29.0% |
| Apache | 100.0 /100 | #48 | Exceptional 29.0% |
| Jordanians | 100.0 /100 | #49 | Exceptional 29.0% |
| Immigrants | Immigrants | 100.0 /100 | #50 | Exceptional 28.9% |
| Immigrants | Peru | 100.0 /100 | #51 | Exceptional 28.9% |
| Guatemalans | 100.0 /100 | #52 | Exceptional 28.9% |
| Immigrants | Cambodia | 100.0 /100 | #53 | Exceptional 28.9% |
| Sierra Leoneans | 100.0 /100 | #54 | Exceptional 28.9% |
| Immigrants | Asia | 100.0 /100 | #55 | Exceptional 28.8% |
| Immigrants | Guatemala | 100.0 /100 | #56 | Exceptional 28.8% |
| Danes | 100.0 /100 | #57 | Exceptional 28.7% |
| Hawaiians | 100.0 /100 | #58 | Exceptional 28.7% |
| Immigrants | Nigeria | 100.0 /100 | #59 | Exceptional 28.6% |
Demographics Similar to Immigrants from Portugal by Family Households with Children
In terms of family households with children, the demographic groups most similar to Immigrants from Portugal are Immigrants from Dominican Republic (27.7%, a difference of 0.010%), Immigrants from Ecuador (27.7%, a difference of 0.020%), Immigrants from Panama (27.7%, a difference of 0.030%), Iranian (27.7%, a difference of 0.040%), and Uruguayan (27.7%, a difference of 0.040%).
| Demographics | Rating | Rank | Family Households with Children |
| Immigrants | Eritrea | 89.4 /100 | #129 | Excellent 27.8% |
| Cajuns | 87.6 /100 | #130 | Excellent 27.7% |
| Lebanese | 87.4 /100 | #131 | Excellent 27.7% |
| Immigrants | Belize | 85.7 /100 | #132 | Excellent 27.7% |
| Iranians | 85.2 /100 | #133 | Excellent 27.7% |
| Immigrants | Panama | 84.9 /100 | #134 | Excellent 27.7% |
| Immigrants | Ecuador | 84.6 /100 | #135 | Excellent 27.7% |
| Immigrants | Portugal | 84.1 /100 | #136 | Excellent 27.7% |
| Immigrants | Dominican Republic | 83.9 /100 | #137 | Excellent 27.7% |
| Uruguayans | 83.2 /100 | #138 | Excellent 27.7% |
| Vietnamese | 82.6 /100 | #139 | Excellent 27.7% |
| Spanish | 81.8 /100 | #140 | Excellent 27.7% |
| Immigrants | Eastern Asia | 81.7 /100 | #141 | Excellent 27.7% |
| Swiss | 81.4 /100 | #142 | Excellent 27.7% |
| Immigrants | Eastern Africa | 80.2 /100 | #143 | Excellent 27.7% |