Immigrants from Egypt vs Immigrants from Oceania Male Disability
COMPARE
Immigrants from Egypt
Immigrants from Oceania
Male Disability
Male Disability Comparison
Immigrants from Egypt
Immigrants from Oceania
10.1%
MALE DISABILITY
99.9/ 100
METRIC RATING
30th/ 347
METRIC RANK
11.4%
MALE DISABILITY
20.9/ 100
METRIC RATING
195th/ 347
METRIC RANK
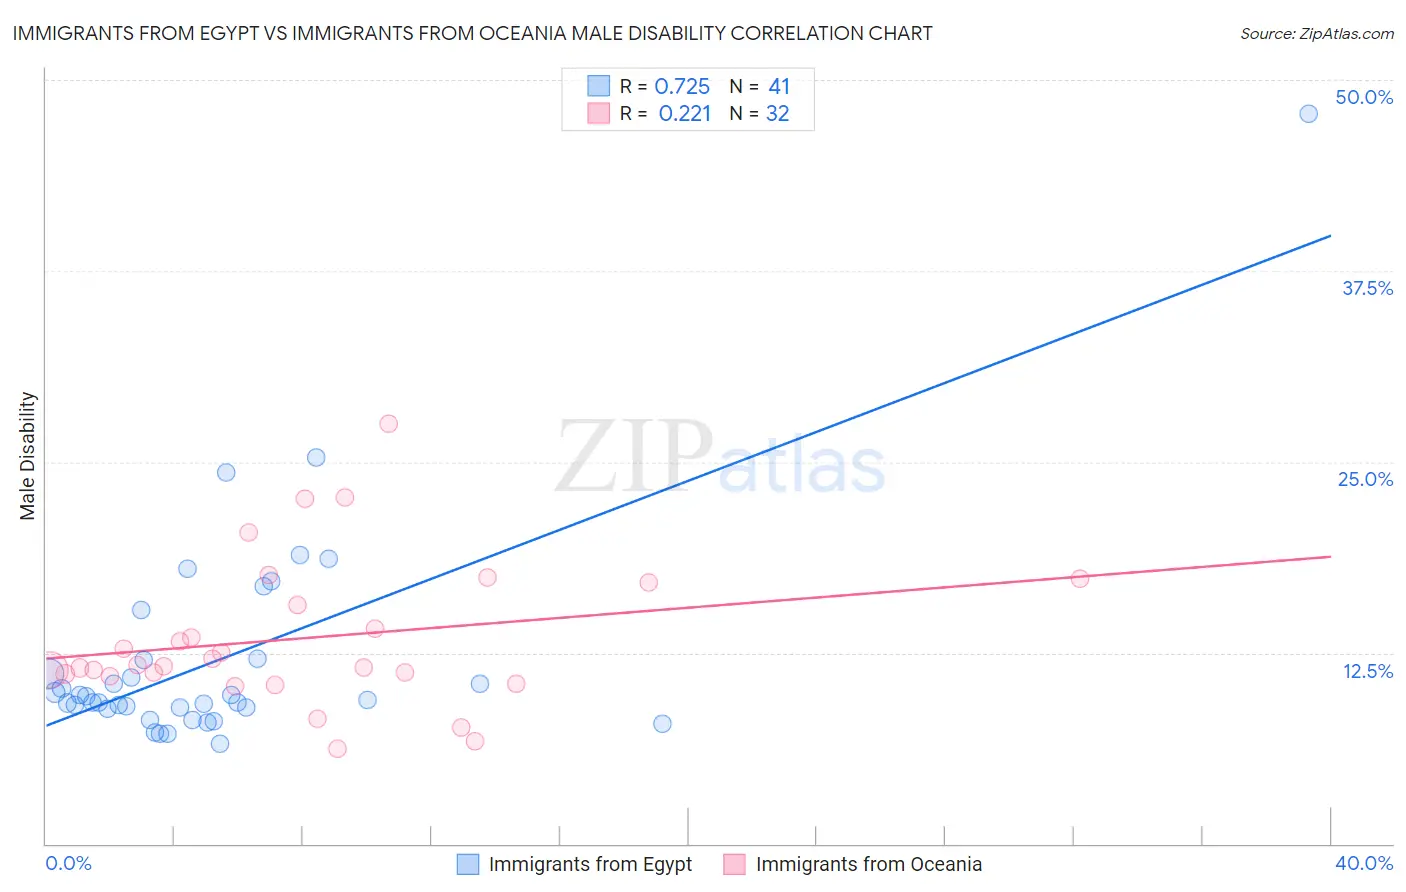
Immigrants from Egypt vs Immigrants from Oceania Male Disability Correlation Chart
The statistical analysis conducted on geographies consisting of 245,488,191 people shows a strong positive correlation between the proportion of Immigrants from Egypt and percentage of males with a disability in the United States with a correlation coefficient (R) of 0.725 and weighted average of 10.1%. Similarly, the statistical analysis conducted on geographies consisting of 305,477,901 people shows a weak positive correlation between the proportion of Immigrants from Oceania and percentage of males with a disability in the United States with a correlation coefficient (R) of 0.221 and weighted average of 11.4%, a difference of 13.0%.
Male Disability Correlation Summary
| Measurement | Immigrants from Egypt | Immigrants from Oceania |
| Minimum | 6.5% | 6.2% |
| Maximum | 47.8% | 27.5% |
| Range | 41.3% | 21.3% |
| Mean | 12.1% | 13.4% |
| Median | 9.4% | 11.7% |
| Interquartile 25% (IQ1) | 8.9% | 11.0% |
| Interquartile 75% (IQ3) | 12.0% | 16.4% |
| Interquartile Range (IQR) | 3.2% | 5.4% |
| Standard Deviation (Sample) | 7.3% | 4.8% |
| Standard Deviation (Population) | 7.2% | 4.7% |
Similar Demographics by Male Disability
Demographics Similar to Immigrants from Egypt by Male Disability
In terms of male disability, the demographic groups most similar to Immigrants from Egypt are Venezuelan (10.1%, a difference of 0.040%), Soviet Union (10.1%, a difference of 0.070%), Vietnamese (10.1%, a difference of 0.19%), Egyptian (10.1%, a difference of 0.21%), and Argentinean (10.1%, a difference of 0.22%).
| Demographics | Rating | Rank | Male Disability |
| Cypriots | 100.0 /100 | #23 | Exceptional 10.0% |
| Immigrants | Asia | 100.0 /100 | #24 | Exceptional 10.0% |
| Immigrants | Malaysia | 99.9 /100 | #25 | Exceptional 10.0% |
| Paraguayans | 99.9 /100 | #26 | Exceptional 10.1% |
| Egyptians | 99.9 /100 | #27 | Exceptional 10.1% |
| Vietnamese | 99.9 /100 | #28 | Exceptional 10.1% |
| Venezuelans | 99.9 /100 | #29 | Exceptional 10.1% |
| Immigrants | Egypt | 99.9 /100 | #30 | Exceptional 10.1% |
| Soviet Union | 99.9 /100 | #31 | Exceptional 10.1% |
| Argentineans | 99.9 /100 | #32 | Exceptional 10.1% |
| Immigrants | Ethiopia | 99.9 /100 | #33 | Exceptional 10.2% |
| Immigrants | Turkey | 99.9 /100 | #34 | Exceptional 10.2% |
| Immigrants | Argentina | 99.9 /100 | #35 | Exceptional 10.2% |
| Ethiopians | 99.8 /100 | #36 | Exceptional 10.2% |
| Immigrants | Indonesia | 99.8 /100 | #37 | Exceptional 10.2% |
Demographics Similar to Immigrants from Oceania by Male Disability
In terms of male disability, the demographic groups most similar to Immigrants from Oceania are Belizean (11.4%, a difference of 0.030%), Greek (11.4%, a difference of 0.11%), Assyrian/Chaldean/Syriac (11.4%, a difference of 0.18%), Senegalese (11.4%, a difference of 0.19%), and West Indian (11.4%, a difference of 0.22%).
| Demographics | Rating | Rank | Male Disability |
| Estonians | 26.8 /100 | #188 | Fair 11.4% |
| Immigrants | Netherlands | 25.9 /100 | #189 | Fair 11.4% |
| Immigrants | Bosnia and Herzegovina | 25.4 /100 | #190 | Fair 11.4% |
| Senegalese | 23.2 /100 | #191 | Fair 11.4% |
| Assyrians/Chaldeans/Syriacs | 23.2 /100 | #192 | Fair 11.4% |
| Greeks | 22.2 /100 | #193 | Fair 11.4% |
| Belizeans | 21.2 /100 | #194 | Fair 11.4% |
| Immigrants | Oceania | 20.9 /100 | #195 | Fair 11.4% |
| West Indians | 18.4 /100 | #196 | Poor 11.4% |
| Somalis | 18.2 /100 | #197 | Poor 11.4% |
| Immigrants | Jamaica | 16.3 /100 | #198 | Poor 11.5% |
| Lebanese | 15.4 /100 | #199 | Poor 11.5% |
| Immigrants | Iraq | 13.0 /100 | #200 | Poor 11.5% |
| Immigrants | Panama | 13.0 /100 | #201 | Poor 11.5% |
| Immigrants | Mexico | 12.6 /100 | #202 | Poor 11.5% |