West Indian vs Immigrants from Oceania Male Disability
COMPARE
West Indian
Immigrants from Oceania
Male Disability
Male Disability Comparison
West Indians
Immigrants from Oceania
11.4%
MALE DISABILITY
18.4/ 100
METRIC RATING
196th/ 347
METRIC RANK
11.4%
MALE DISABILITY
20.9/ 100
METRIC RATING
195th/ 347
METRIC RANK
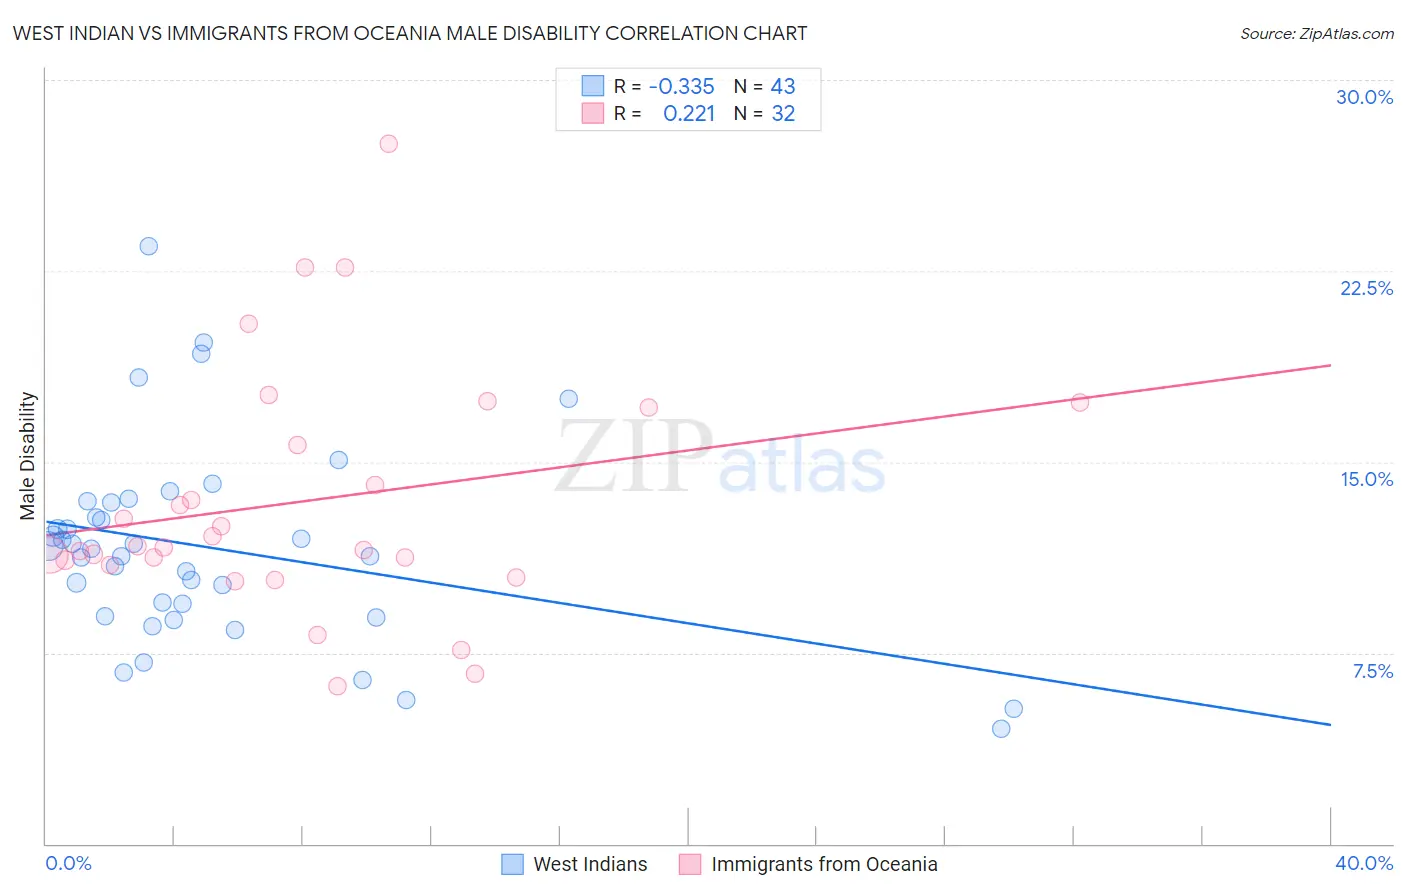
West Indian vs Immigrants from Oceania Male Disability Correlation Chart
The statistical analysis conducted on geographies consisting of 254,013,623 people shows a mild negative correlation between the proportion of West Indians and percentage of males with a disability in the United States with a correlation coefficient (R) of -0.335 and weighted average of 11.4%. Similarly, the statistical analysis conducted on geographies consisting of 305,477,901 people shows a weak positive correlation between the proportion of Immigrants from Oceania and percentage of males with a disability in the United States with a correlation coefficient (R) of 0.221 and weighted average of 11.4%, a difference of 0.22%.
Male Disability Correlation Summary
| Measurement | West Indian | Immigrants from Oceania |
| Minimum | 4.5% | 6.2% |
| Maximum | 23.5% | 27.5% |
| Range | 19.0% | 21.3% |
| Mean | 11.6% | 13.4% |
| Median | 11.6% | 11.7% |
| Interquartile 25% (IQ1) | 8.9% | 11.0% |
| Interquartile 75% (IQ3) | 13.4% | 16.4% |
| Interquartile Range (IQR) | 4.5% | 5.4% |
| Standard Deviation (Sample) | 3.9% | 4.8% |
| Standard Deviation (Population) | 3.8% | 4.7% |
Demographics Similar to West Indians and Immigrants from Oceania by Male Disability
In terms of male disability, the demographic groups most similar to West Indians are Somali (11.4%, a difference of 0.020%), Immigrants from Jamaica (11.5%, a difference of 0.20%), Belizean (11.4%, a difference of 0.24%), Lebanese (11.5%, a difference of 0.29%), and Greek (11.4%, a difference of 0.33%). Similarly, the demographic groups most similar to Immigrants from Oceania are Belizean (11.4%, a difference of 0.030%), Greek (11.4%, a difference of 0.11%), Assyrian/Chaldean/Syriac (11.4%, a difference of 0.18%), Senegalese (11.4%, a difference of 0.19%), and Somali (11.4%, a difference of 0.23%).
| Demographics | Rating | Rank | Male Disability |
| Pakistanis | 30.3 /100 | #185 | Fair 11.3% |
| Immigrants | Zaire | 27.6 /100 | #186 | Fair 11.4% |
| Immigrants | Austria | 27.3 /100 | #187 | Fair 11.4% |
| Estonians | 26.8 /100 | #188 | Fair 11.4% |
| Immigrants | Netherlands | 25.9 /100 | #189 | Fair 11.4% |
| Immigrants | Bosnia and Herzegovina | 25.4 /100 | #190 | Fair 11.4% |
| Senegalese | 23.2 /100 | #191 | Fair 11.4% |
| Assyrians/Chaldeans/Syriacs | 23.2 /100 | #192 | Fair 11.4% |
| Greeks | 22.2 /100 | #193 | Fair 11.4% |
| Belizeans | 21.2 /100 | #194 | Fair 11.4% |
| Immigrants | Oceania | 20.9 /100 | #195 | Fair 11.4% |
| West Indians | 18.4 /100 | #196 | Poor 11.4% |
| Somalis | 18.2 /100 | #197 | Poor 11.4% |
| Immigrants | Jamaica | 16.3 /100 | #198 | Poor 11.5% |
| Lebanese | 15.4 /100 | #199 | Poor 11.5% |
| Immigrants | Iraq | 13.0 /100 | #200 | Poor 11.5% |
| Immigrants | Panama | 13.0 /100 | #201 | Poor 11.5% |
| Immigrants | Mexico | 12.6 /100 | #202 | Poor 11.5% |
| Jamaicans | 10.9 /100 | #203 | Poor 11.5% |
| Immigrants | Cambodia | 10.8 /100 | #204 | Poor 11.5% |
| Serbians | 10.7 /100 | #205 | Poor 11.5% |