Guatemalan vs Immigrants from Oceania Female Poverty Among 25-34 Year Olds
COMPARE
Guatemalan
Immigrants from Oceania
Female Poverty Among 25-34 Year Olds
Female Poverty Among 25-34 Year Olds Comparison
Guatemalans
Immigrants from Oceania
16.4%
FEMALE POVERTY AMONG 25-34 YEAR OLDS
0.0/ 100
METRIC RATING
288th/ 347
METRIC RANK
13.5%
FEMALE POVERTY AMONG 25-34 YEAR OLDS
50.0/ 100
METRIC RATING
174th/ 347
METRIC RANK
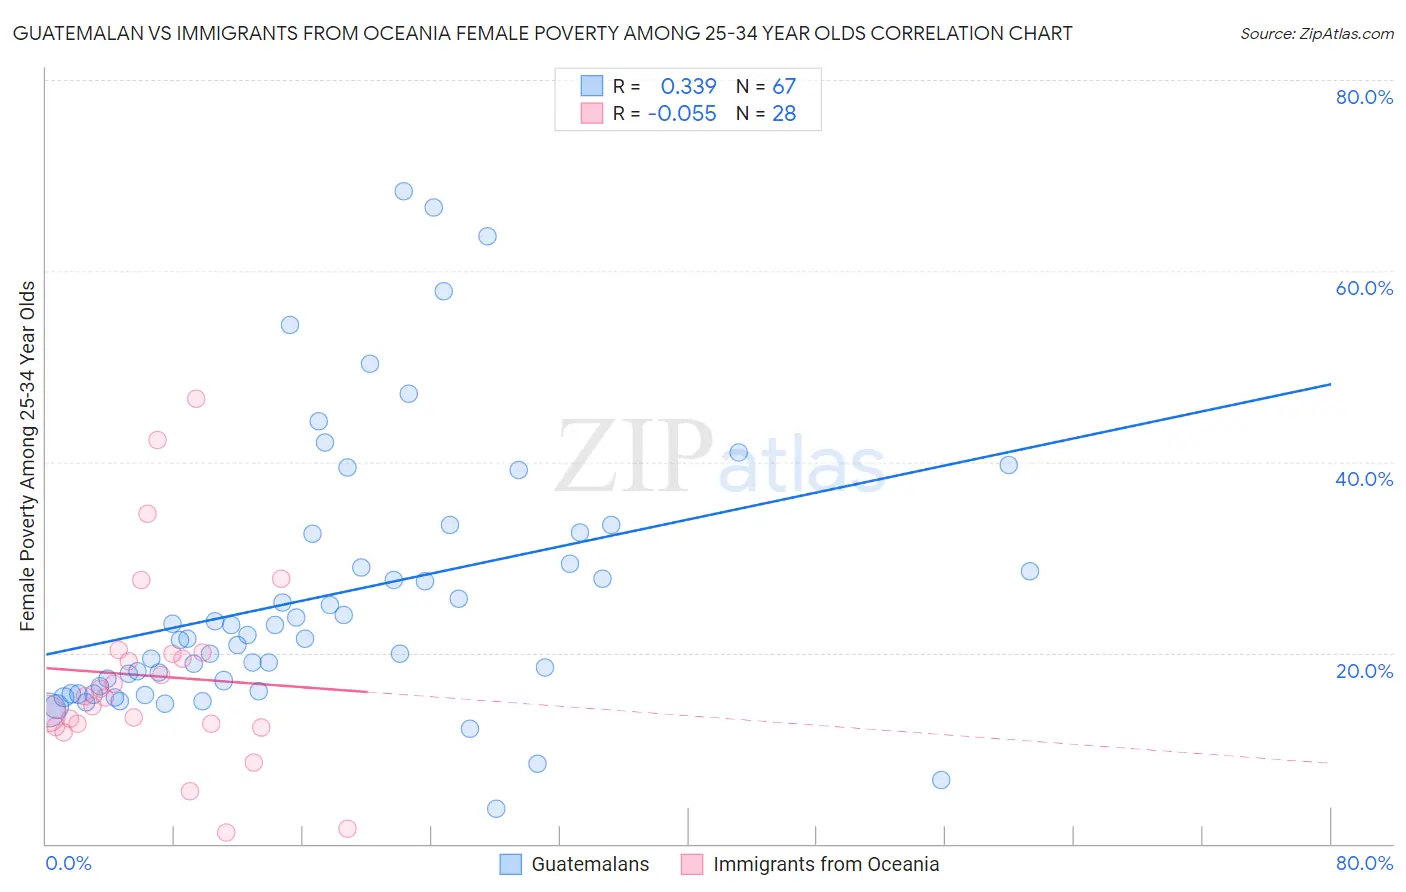
Guatemalan vs Immigrants from Oceania Female Poverty Among 25-34 Year Olds Correlation Chart
The statistical analysis conducted on geographies consisting of 404,378,710 people shows a mild positive correlation between the proportion of Guatemalans and poverty level among females between the ages 25 and 34 in the United States with a correlation coefficient (R) of 0.339 and weighted average of 16.4%. Similarly, the statistical analysis conducted on geographies consisting of 301,478,859 people shows a slight negative correlation between the proportion of Immigrants from Oceania and poverty level among females between the ages 25 and 34 in the United States with a correlation coefficient (R) of -0.055 and weighted average of 13.5%, a difference of 21.1%.
Female Poverty Among 25-34 Year Olds Correlation Summary
| Measurement | Guatemalan | Immigrants from Oceania |
| Minimum | 3.7% | 1.2% |
| Maximum | 68.3% | 46.7% |
| Range | 64.6% | 45.4% |
| Mean | 26.0% | 17.6% |
| Median | 21.5% | 15.4% |
| Interquartile 25% (IQ1) | 15.9% | 12.4% |
| Interquartile 75% (IQ3) | 32.4% | 19.9% |
| Interquartile Range (IQR) | 16.5% | 7.5% |
| Standard Deviation (Sample) | 14.1% | 10.5% |
| Standard Deviation (Population) | 14.0% | 10.3% |
Similar Demographics by Female Poverty Among 25-34 Year Olds
Demographics Similar to Guatemalans by Female Poverty Among 25-34 Year Olds
In terms of female poverty among 25-34 year olds, the demographic groups most similar to Guatemalans are Osage (16.4%, a difference of 0.060%), American (16.4%, a difference of 0.19%), Indonesian (16.4%, a difference of 0.22%), Cape Verdean (16.3%, a difference of 0.24%), and Immigrants from Bahamas (16.3%, a difference of 0.42%).
| Demographics | Rating | Rank | Female Poverty Among 25-34 Year Olds |
| Immigrants | Latin America | 0.0 /100 | #281 | Tragic 16.0% |
| Aleuts | 0.0 /100 | #282 | Tragic 16.1% |
| Bahamians | 0.0 /100 | #283 | Tragic 16.1% |
| Shoshone | 0.0 /100 | #284 | Tragic 16.2% |
| Immigrants | Bahamas | 0.0 /100 | #285 | Tragic 16.3% |
| Cape Verdeans | 0.0 /100 | #286 | Tragic 16.3% |
| Americans | 0.0 /100 | #287 | Tragic 16.4% |
| Guatemalans | 0.0 /100 | #288 | Tragic 16.4% |
| Osage | 0.0 /100 | #289 | Tragic 16.4% |
| Indonesians | 0.0 /100 | #290 | Tragic 16.4% |
| Comanche | 0.0 /100 | #291 | Tragic 16.5% |
| Immigrants | Dominica | 0.0 /100 | #292 | Tragic 16.5% |
| Potawatomi | 0.0 /100 | #293 | Tragic 16.5% |
| Immigrants | Central America | 0.0 /100 | #294 | Tragic 16.6% |
| Mexicans | 0.0 /100 | #295 | Tragic 16.6% |
Demographics Similar to Immigrants from Oceania by Female Poverty Among 25-34 Year Olds
In terms of female poverty among 25-34 year olds, the demographic groups most similar to Immigrants from Oceania are Kenyan (13.5%, a difference of 0.15%), South American Indian (13.5%, a difference of 0.16%), Immigrants from Costa Rica (13.5%, a difference of 0.16%), Immigrants from Uganda (13.5%, a difference of 0.25%), and Bermudan (13.6%, a difference of 0.26%).
| Demographics | Rating | Rank | Female Poverty Among 25-34 Year Olds |
| Immigrants | Bosnia and Herzegovina | 58.6 /100 | #167 | Average 13.4% |
| Immigrants | Afghanistan | 57.7 /100 | #168 | Average 13.4% |
| Samoans | 56.8 /100 | #169 | Average 13.5% |
| Immigrants | Uganda | 53.0 /100 | #170 | Average 13.5% |
| South American Indians | 51.9 /100 | #171 | Average 13.5% |
| Immigrants | Costa Rica | 51.9 /100 | #172 | Average 13.5% |
| Kenyans | 51.8 /100 | #173 | Average 13.5% |
| Immigrants | Oceania | 50.0 /100 | #174 | Average 13.5% |
| Bermudans | 46.8 /100 | #175 | Average 13.6% |
| Yugoslavians | 45.0 /100 | #176 | Average 13.6% |
| Venezuelans | 44.6 /100 | #177 | Average 13.6% |
| Canadians | 44.3 /100 | #178 | Average 13.6% |
| Immigrants | Eastern Africa | 43.6 /100 | #179 | Average 13.6% |
| Germans | 41.6 /100 | #180 | Average 13.6% |
| Guamanians/Chamorros | 41.5 /100 | #181 | Average 13.6% |