Guatemalan vs Immigrants from Canada Ambulatory Disability
COMPARE
Guatemalan
Immigrants from Canada
Ambulatory Disability
Ambulatory Disability Comparison
Guatemalans
Immigrants from Canada
6.2%
AMBULATORY DISABILITY
30.0/ 100
METRIC RATING
193rd/ 347
METRIC RANK
6.1%
AMBULATORY DISABILITY
50.0/ 100
METRIC RATING
174th/ 347
METRIC RANK
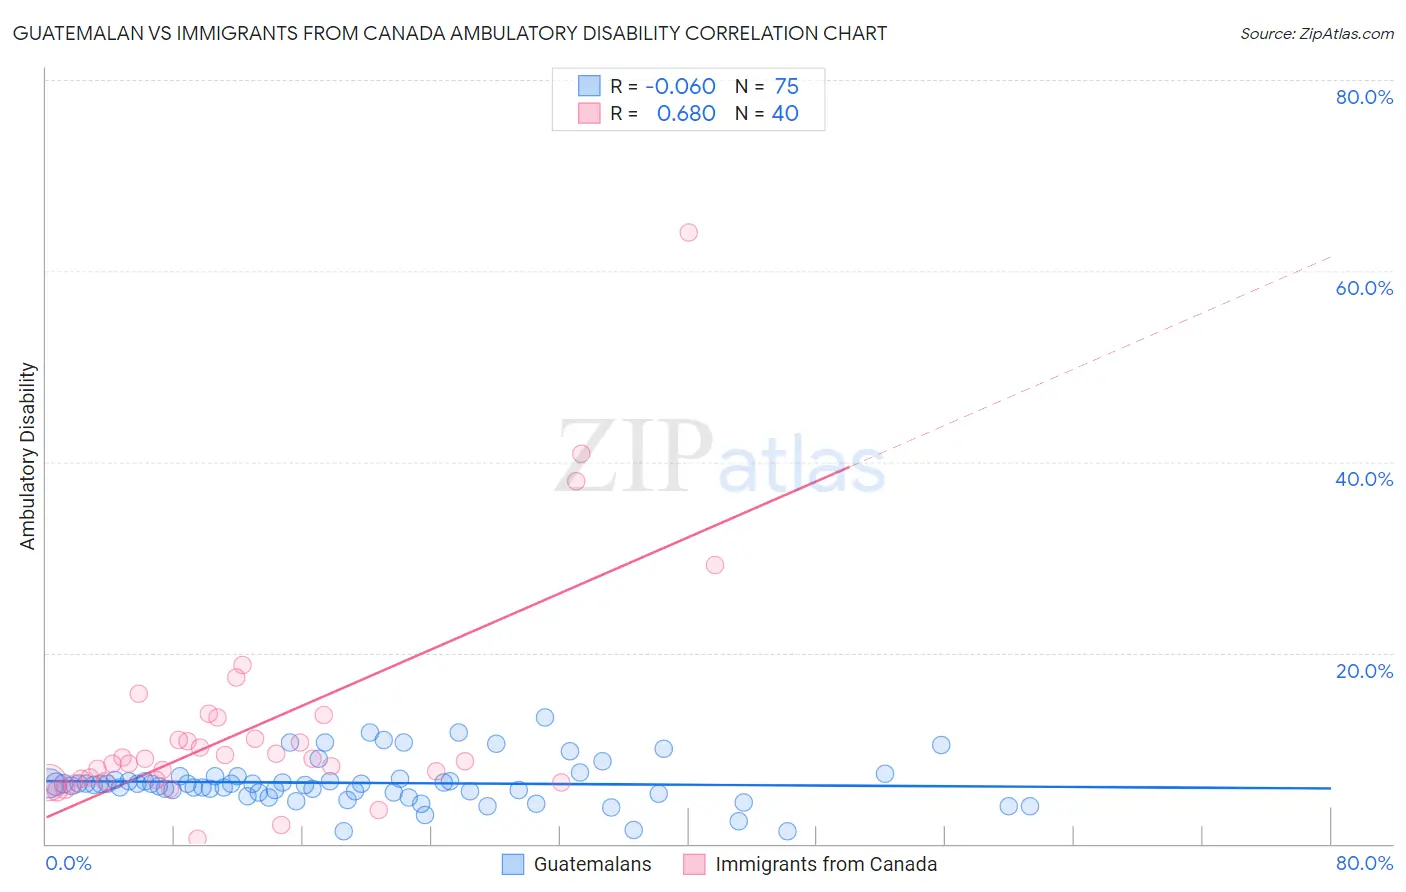
Guatemalan vs Immigrants from Canada Ambulatory Disability Correlation Chart
The statistical analysis conducted on geographies consisting of 409,382,771 people shows a slight negative correlation between the proportion of Guatemalans and percentage of population with ambulatory disability in the United States with a correlation coefficient (R) of -0.060 and weighted average of 6.2%. Similarly, the statistical analysis conducted on geographies consisting of 459,245,879 people shows a significant positive correlation between the proportion of Immigrants from Canada and percentage of population with ambulatory disability in the United States with a correlation coefficient (R) of 0.680 and weighted average of 6.1%, a difference of 1.1%.
Ambulatory Disability Correlation Summary
| Measurement | Guatemalan | Immigrants from Canada |
| Minimum | 1.3% | 0.55% |
| Maximum | 13.2% | 64.0% |
| Range | 11.9% | 63.4% |
| Mean | 6.4% | 12.2% |
| Median | 6.2% | 8.8% |
| Interquartile 25% (IQ1) | 5.3% | 6.6% |
| Interquartile 75% (IQ3) | 6.8% | 12.1% |
| Interquartile Range (IQR) | 1.5% | 5.5% |
| Standard Deviation (Sample) | 2.4% | 11.8% |
| Standard Deviation (Population) | 2.3% | 11.6% |
Demographics Similar to Guatemalans and Immigrants from Canada by Ambulatory Disability
In terms of ambulatory disability, the demographic groups most similar to Guatemalans are Immigrants from Western Europe (6.2%, a difference of 0.10%), Immigrants from Guatemala (6.2%, a difference of 0.12%), Immigrants from Western Africa (6.2%, a difference of 0.21%), Ukrainian (6.2%, a difference of 0.24%), and British (6.2%, a difference of 0.26%). Similarly, the demographic groups most similar to Immigrants from Canada are Croatian (6.1%, a difference of 0.060%), Vietnamese (6.1%, a difference of 0.15%), Immigrants from North America (6.1%, a difference of 0.23%), Immigrants from England (6.1%, a difference of 0.25%), and Scandinavian (6.1%, a difference of 0.29%).
| Demographics | Rating | Rank | Ambulatory Disability |
| Croatians | 51.2 /100 | #173 | Average 6.1% |
| Immigrants | Canada | 50.0 /100 | #174 | Average 6.1% |
| Vietnamese | 47.2 /100 | #175 | Average 6.1% |
| Immigrants | North America | 45.6 /100 | #176 | Average 6.1% |
| Immigrants | England | 45.4 /100 | #177 | Average 6.1% |
| Scandinavians | 44.5 /100 | #178 | Average 6.1% |
| Austrians | 44.1 /100 | #179 | Average 6.1% |
| Immigrants | Nicaragua | 43.9 /100 | #180 | Average 6.1% |
| Swiss | 43.1 /100 | #181 | Average 6.1% |
| Serbians | 42.8 /100 | #182 | Average 6.1% |
| Immigrants | Thailand | 42.2 /100 | #183 | Average 6.1% |
| Immigrants | Ghana | 41.2 /100 | #184 | Average 6.1% |
| Immigrants | Bosnia and Herzegovina | 37.2 /100 | #185 | Fair 6.2% |
| Europeans | 36.2 /100 | #186 | Fair 6.2% |
| Carpatho Rusyns | 35.3 /100 | #187 | Fair 6.2% |
| British | 34.3 /100 | #188 | Fair 6.2% |
| Ukrainians | 34.0 /100 | #189 | Fair 6.2% |
| Immigrants | Western Africa | 33.4 /100 | #190 | Fair 6.2% |
| Immigrants | Guatemala | 31.9 /100 | #191 | Fair 6.2% |
| Immigrants | Western Europe | 31.6 /100 | #192 | Fair 6.2% |
| Guatemalans | 30.0 /100 | #193 | Fair 6.2% |