Guatemalan vs Immigrants from Canada Unemployment Among Ages 55 to 59 years
COMPARE
Guatemalan
Immigrants from Canada
Unemployment Among Ages 55 to 59 years
Unemployment Among Ages 55 to 59 years Comparison
Guatemalans
Immigrants from Canada
5.3%
UNEMPLOYMENT AMONG AGES 55 TO 59 YEARS
0.0/ 100
METRIC RATING
281st/ 347
METRIC RANK
4.7%
UNEMPLOYMENT AMONG AGES 55 TO 59 YEARS
94.9/ 100
METRIC RATING
97th/ 347
METRIC RANK
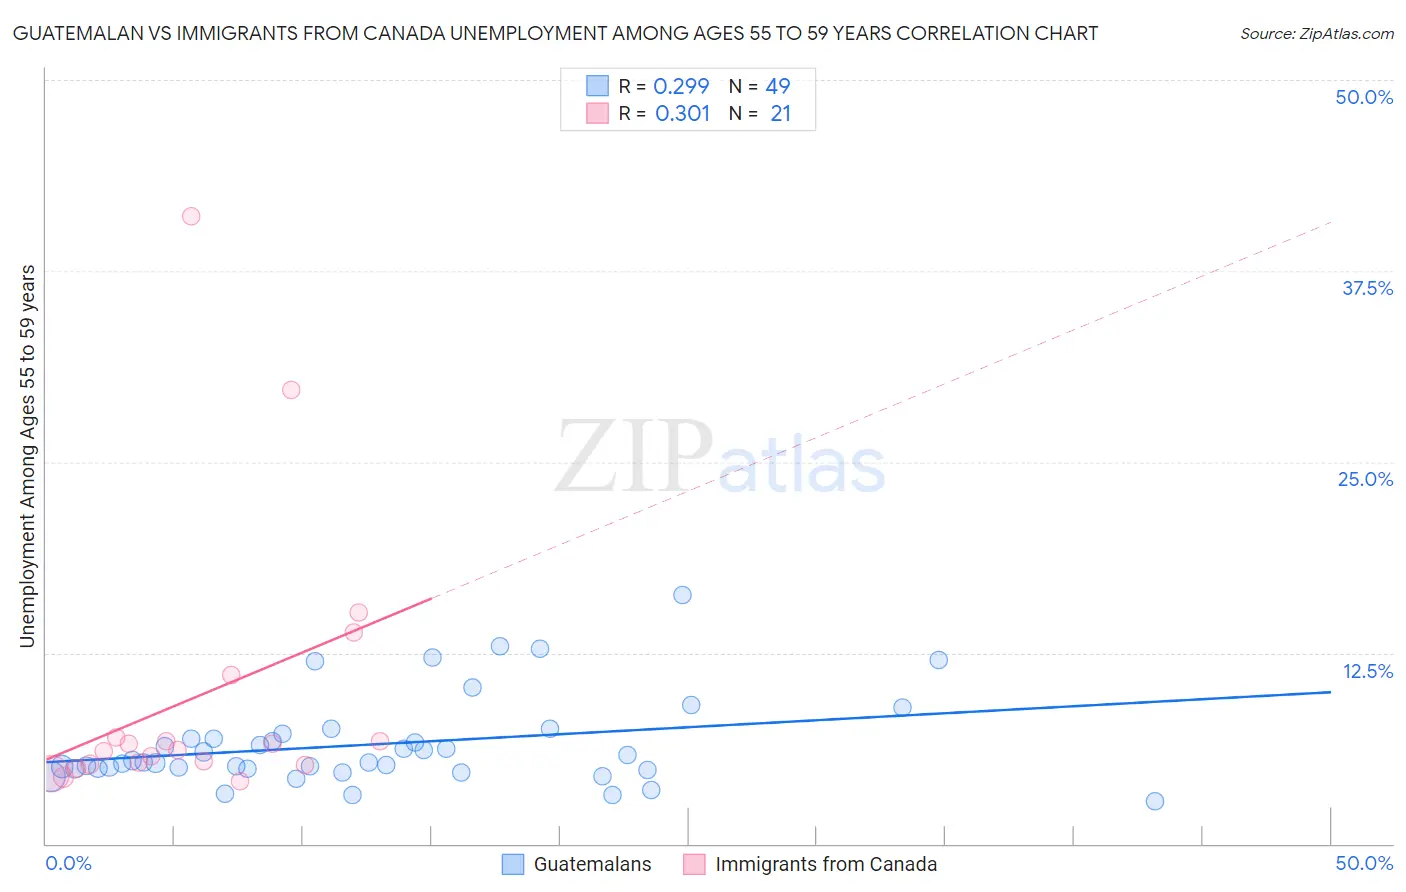
Guatemalan vs Immigrants from Canada Unemployment Among Ages 55 to 59 years Correlation Chart
The statistical analysis conducted on geographies consisting of 380,003,444 people shows a weak positive correlation between the proportion of Guatemalans and unemployment rate among population between the ages 55 and 59 in the United States with a correlation coefficient (R) of 0.299 and weighted average of 5.3%. Similarly, the statistical analysis conducted on geographies consisting of 417,489,457 people shows a mild positive correlation between the proportion of Immigrants from Canada and unemployment rate among population between the ages 55 and 59 in the United States with a correlation coefficient (R) of 0.301 and weighted average of 4.7%, a difference of 12.6%.
Unemployment Among Ages 55 to 59 years Correlation Summary
| Measurement | Guatemalan | Immigrants from Canada |
| Minimum | 2.8% | 4.1% |
| Maximum | 16.3% | 41.1% |
| Range | 13.5% | 37.0% |
| Mean | 6.5% | 9.6% |
| Median | 5.3% | 6.1% |
| Interquartile 25% (IQ1) | 4.9% | 5.2% |
| Interquartile 75% (IQ3) | 7.0% | 9.0% |
| Interquartile Range (IQR) | 2.1% | 3.8% |
| Standard Deviation (Sample) | 2.9% | 9.2% |
| Standard Deviation (Population) | 2.9% | 9.0% |
Similar Demographics by Unemployment Among Ages 55 to 59 years
Demographics Similar to Guatemalans by Unemployment Among Ages 55 to 59 years
In terms of unemployment among ages 55 to 59 years, the demographic groups most similar to Guatemalans are Immigrants from Uzbekistan (5.3%, a difference of 0.15%), Immigrants from Trinidad and Tobago (5.3%, a difference of 0.27%), Apache (5.3%, a difference of 0.30%), Ghanaian (5.3%, a difference of 0.34%), and Alsatian (5.2%, a difference of 0.36%).
| Demographics | Rating | Rank | Unemployment Among Ages 55 to 59 years |
| Mexican American Indians | 0.0 /100 | #274 | Tragic 5.2% |
| Israelis | 0.0 /100 | #275 | Tragic 5.2% |
| West Indians | 0.0 /100 | #276 | Tragic 5.2% |
| Immigrants | Latin America | 0.0 /100 | #277 | Tragic 5.2% |
| Immigrants | Barbados | 0.0 /100 | #278 | Tragic 5.2% |
| Alsatians | 0.0 /100 | #279 | Tragic 5.2% |
| Immigrants | Uzbekistan | 0.0 /100 | #280 | Tragic 5.3% |
| Guatemalans | 0.0 /100 | #281 | Tragic 5.3% |
| Immigrants | Trinidad and Tobago | 0.0 /100 | #282 | Tragic 5.3% |
| Apache | 0.0 /100 | #283 | Tragic 5.3% |
| Ghanaians | 0.0 /100 | #284 | Tragic 5.3% |
| Armenians | 0.0 /100 | #285 | Tragic 5.3% |
| Immigrants | Ghana | 0.0 /100 | #286 | Tragic 5.3% |
| Immigrants | Guatemala | 0.0 /100 | #287 | Tragic 5.3% |
| Immigrants | Israel | 0.0 /100 | #288 | Tragic 5.3% |
Demographics Similar to Immigrants from Canada by Unemployment Among Ages 55 to 59 years
In terms of unemployment among ages 55 to 59 years, the demographic groups most similar to Immigrants from Canada are Immigrants from Belgium (4.7%, a difference of 0.010%), Immigrants from Germany (4.7%, a difference of 0.010%), Yugoslavian (4.7%, a difference of 0.040%), Serbian (4.7%, a difference of 0.11%), and Celtic (4.7%, a difference of 0.12%).
| Demographics | Rating | Rank | Unemployment Among Ages 55 to 59 years |
| Immigrants | Poland | 96.4 /100 | #90 | Exceptional 4.7% |
| New Zealanders | 96.3 /100 | #91 | Exceptional 4.7% |
| Iraqis | 96.1 /100 | #92 | Exceptional 4.7% |
| Immigrants | England | 95.8 /100 | #93 | Exceptional 4.7% |
| Immigrants | Scotland | 95.7 /100 | #94 | Exceptional 4.7% |
| South Africans | 95.6 /100 | #95 | Exceptional 4.7% |
| Immigrants | Belgium | 95.0 /100 | #96 | Exceptional 4.7% |
| Immigrants | Canada | 94.9 /100 | #97 | Exceptional 4.7% |
| Immigrants | Germany | 94.8 /100 | #98 | Exceptional 4.7% |
| Yugoslavians | 94.7 /100 | #99 | Exceptional 4.7% |
| Serbians | 94.4 /100 | #100 | Exceptional 4.7% |
| Celtics | 94.3 /100 | #101 | Exceptional 4.7% |
| Canadians | 94.1 /100 | #102 | Exceptional 4.7% |
| Immigrants | Oceania | 94.0 /100 | #103 | Exceptional 4.7% |
| Immigrants | Turkey | 93.9 /100 | #104 | Exceptional 4.7% |