Guatemalan vs Carpatho Rusyn Ambulatory Disability
COMPARE
Guatemalan
Carpatho Rusyn
Ambulatory Disability
Ambulatory Disability Comparison
Guatemalans
Carpatho Rusyns
6.2%
AMBULATORY DISABILITY
30.0/ 100
METRIC RATING
193rd/ 347
METRIC RANK
6.2%
AMBULATORY DISABILITY
35.3/ 100
METRIC RATING
187th/ 347
METRIC RANK
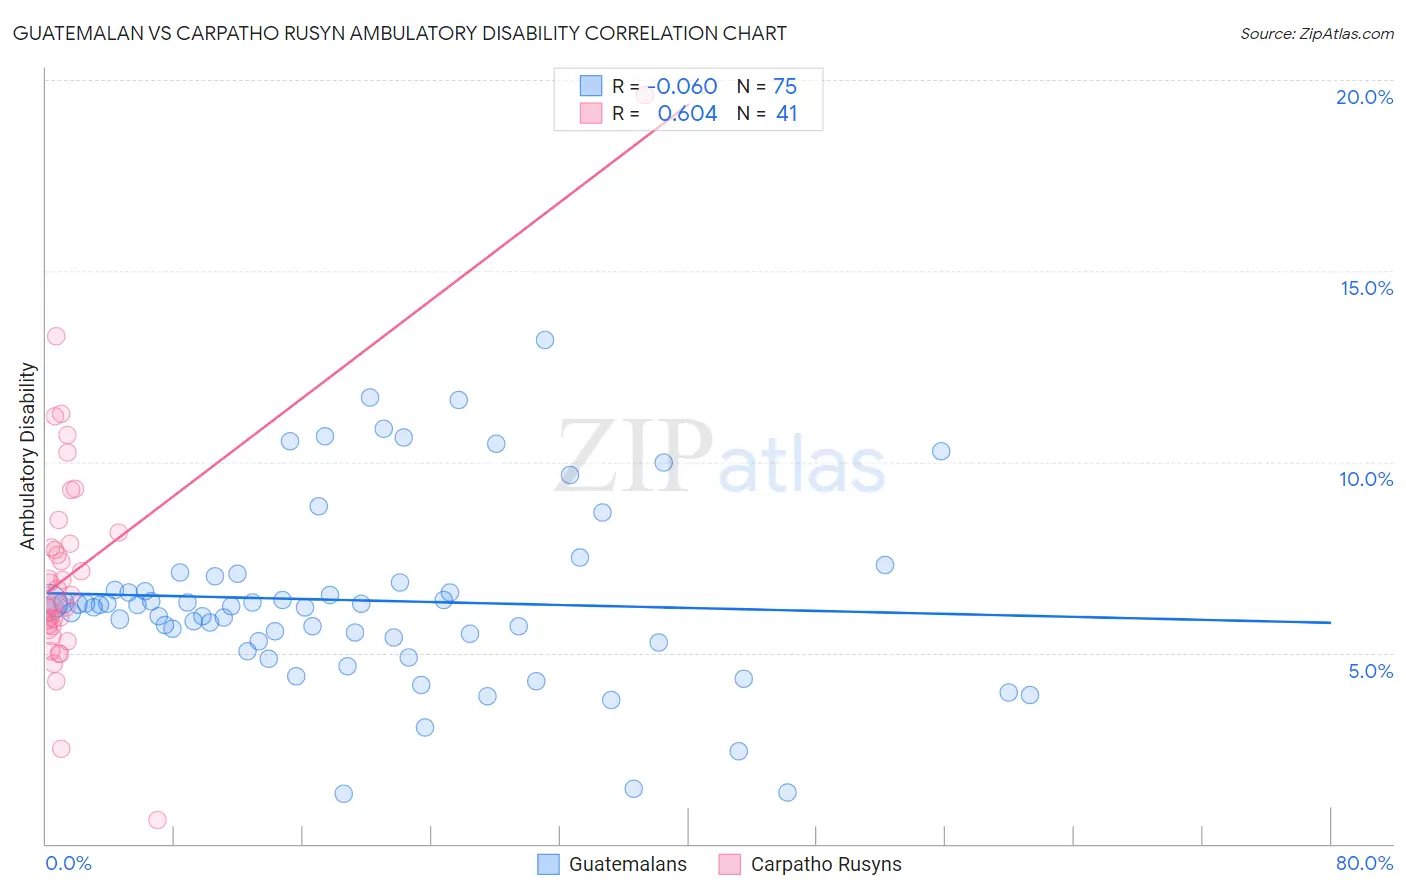
Guatemalan vs Carpatho Rusyn Ambulatory Disability Correlation Chart
The statistical analysis conducted on geographies consisting of 409,382,771 people shows a slight negative correlation between the proportion of Guatemalans and percentage of population with ambulatory disability in the United States with a correlation coefficient (R) of -0.060 and weighted average of 6.2%. Similarly, the statistical analysis conducted on geographies consisting of 58,871,605 people shows a significant positive correlation between the proportion of Carpatho Rusyns and percentage of population with ambulatory disability in the United States with a correlation coefficient (R) of 0.604 and weighted average of 6.2%, a difference of 0.32%.
Ambulatory Disability Correlation Summary
| Measurement | Guatemalan | Carpatho Rusyn |
| Minimum | 1.3% | 0.63% |
| Maximum | 13.2% | 19.6% |
| Range | 11.9% | 19.0% |
| Mean | 6.4% | 7.2% |
| Median | 6.2% | 6.5% |
| Interquartile 25% (IQ1) | 5.3% | 5.7% |
| Interquartile 75% (IQ3) | 6.8% | 8.0% |
| Interquartile Range (IQR) | 1.5% | 2.3% |
| Standard Deviation (Sample) | 2.4% | 3.1% |
| Standard Deviation (Population) | 2.3% | 3.0% |
Demographics Similar to Guatemalans and Carpatho Rusyns by Ambulatory Disability
In terms of ambulatory disability, the demographic groups most similar to Guatemalans are Alaska Native (6.2%, a difference of 0.010%), Belgian (6.2%, a difference of 0.080%), Immigrants from Western Europe (6.2%, a difference of 0.10%), Malaysian (6.2%, a difference of 0.11%), and Immigrants from Guatemala (6.2%, a difference of 0.12%). Similarly, the demographic groups most similar to Carpatho Rusyns are European (6.2%, a difference of 0.050%), British (6.2%, a difference of 0.060%), Ukrainian (6.2%, a difference of 0.080%), Immigrants from Bosnia and Herzegovina (6.2%, a difference of 0.11%), and Immigrants from Western Africa (6.2%, a difference of 0.12%).
| Demographics | Rating | Rank | Ambulatory Disability |
| Immigrants | Nicaragua | 43.9 /100 | #180 | Average 6.1% |
| Swiss | 43.1 /100 | #181 | Average 6.1% |
| Serbians | 42.8 /100 | #182 | Average 6.1% |
| Immigrants | Thailand | 42.2 /100 | #183 | Average 6.1% |
| Immigrants | Ghana | 41.2 /100 | #184 | Average 6.1% |
| Immigrants | Bosnia and Herzegovina | 37.2 /100 | #185 | Fair 6.2% |
| Europeans | 36.2 /100 | #186 | Fair 6.2% |
| Carpatho Rusyns | 35.3 /100 | #187 | Fair 6.2% |
| British | 34.3 /100 | #188 | Fair 6.2% |
| Ukrainians | 34.0 /100 | #189 | Fair 6.2% |
| Immigrants | Western Africa | 33.4 /100 | #190 | Fair 6.2% |
| Immigrants | Guatemala | 31.9 /100 | #191 | Fair 6.2% |
| Immigrants | Western Europe | 31.6 /100 | #192 | Fair 6.2% |
| Guatemalans | 30.0 /100 | #193 | Fair 6.2% |
| Alaska Natives | 29.8 /100 | #194 | Fair 6.2% |
| Belgians | 28.6 /100 | #195 | Fair 6.2% |
| Malaysians | 28.2 /100 | #196 | Fair 6.2% |
| Poles | 26.3 /100 | #197 | Fair 6.2% |
| Immigrants | Bangladesh | 24.6 /100 | #198 | Fair 6.2% |
| Italians | 22.6 /100 | #199 | Fair 6.2% |
| Immigrants | Cambodia | 21.5 /100 | #200 | Fair 6.2% |