Panamanian vs Carpatho Rusyn Ambulatory Disability
COMPARE
Panamanian
Carpatho Rusyn
Ambulatory Disability
Ambulatory Disability Comparison
Panamanians
Carpatho Rusyns
6.4%
AMBULATORY DISABILITY
3.1/ 100
METRIC RATING
231st/ 347
METRIC RANK
6.2%
AMBULATORY DISABILITY
35.3/ 100
METRIC RATING
187th/ 347
METRIC RANK
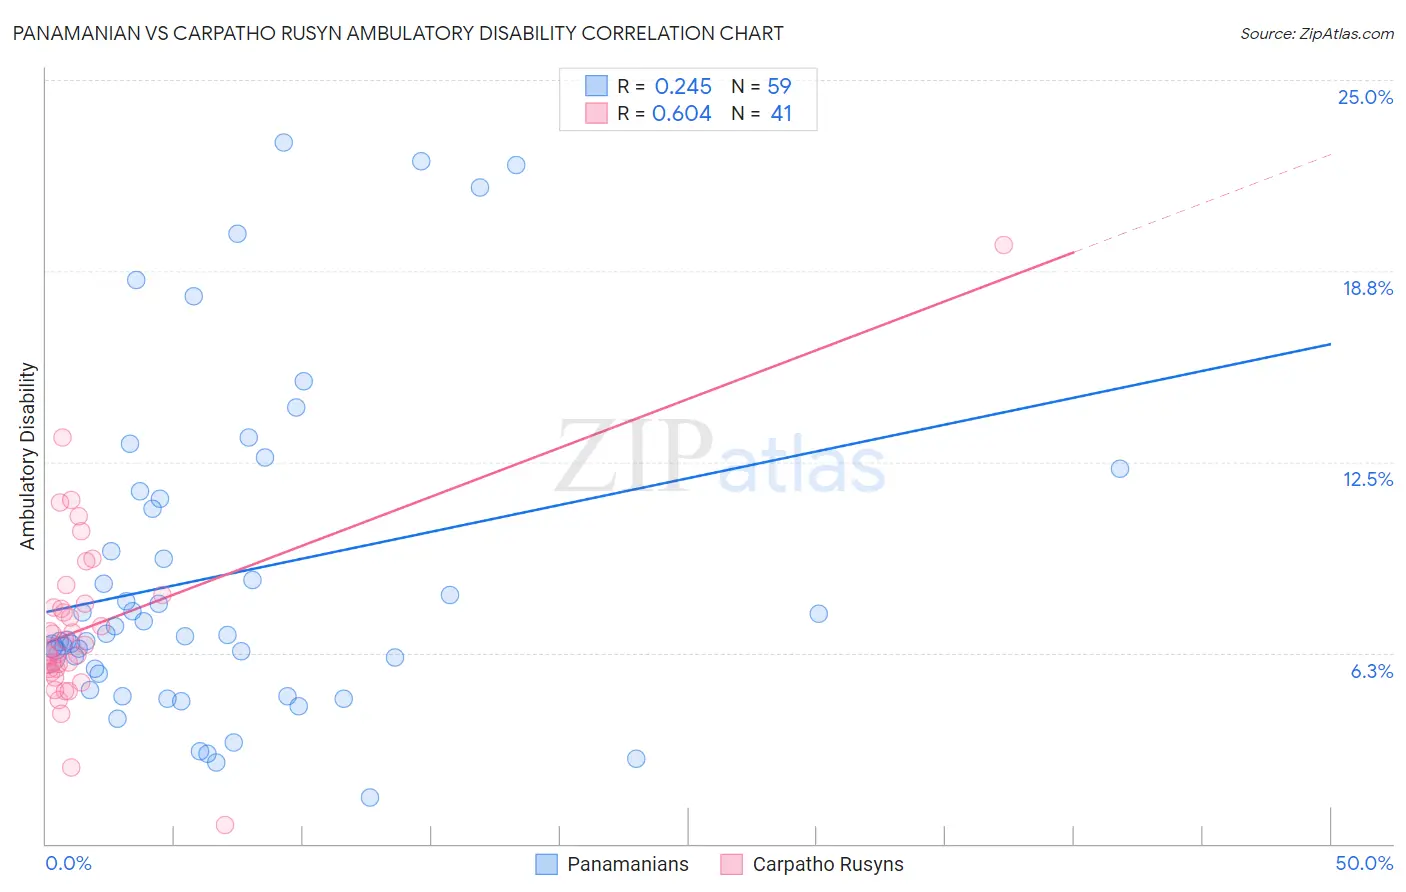
Panamanian vs Carpatho Rusyn Ambulatory Disability Correlation Chart
The statistical analysis conducted on geographies consisting of 281,171,683 people shows a weak positive correlation between the proportion of Panamanians and percentage of population with ambulatory disability in the United States with a correlation coefficient (R) of 0.245 and weighted average of 6.4%. Similarly, the statistical analysis conducted on geographies consisting of 58,871,605 people shows a significant positive correlation between the proportion of Carpatho Rusyns and percentage of population with ambulatory disability in the United States with a correlation coefficient (R) of 0.604 and weighted average of 6.2%, a difference of 3.7%.
Ambulatory Disability Correlation Summary
| Measurement | Panamanian | Carpatho Rusyn |
| Minimum | 1.5% | 0.63% |
| Maximum | 23.0% | 19.6% |
| Range | 21.5% | 19.0% |
| Mean | 8.8% | 7.2% |
| Median | 6.8% | 6.5% |
| Interquartile 25% (IQ1) | 5.6% | 5.7% |
| Interquartile 75% (IQ3) | 11.3% | 8.0% |
| Interquartile Range (IQR) | 5.7% | 2.3% |
| Standard Deviation (Sample) | 5.3% | 3.1% |
| Standard Deviation (Population) | 5.3% | 3.0% |
Similar Demographics by Ambulatory Disability
Demographics Similar to Panamanians by Ambulatory Disability
In terms of ambulatory disability, the demographic groups most similar to Panamanians are Mexican (6.4%, a difference of 0.16%), Czechoslovakian (6.4%, a difference of 0.26%), Portuguese (6.4%, a difference of 0.31%), Cuban (6.4%, a difference of 0.32%), and Assyrian/Chaldean/Syriac (6.4%, a difference of 0.33%).
| Demographics | Rating | Rank | Ambulatory Disability |
| Liberians | 7.1 /100 | #224 | Tragic 6.3% |
| Hondurans | 6.3 /100 | #225 | Tragic 6.3% |
| Slavs | 5.1 /100 | #226 | Tragic 6.4% |
| Cubans | 4.0 /100 | #227 | Tragic 6.4% |
| Portuguese | 4.0 /100 | #228 | Tragic 6.4% |
| Czechoslovakians | 3.8 /100 | #229 | Tragic 6.4% |
| Mexicans | 3.5 /100 | #230 | Tragic 6.4% |
| Panamanians | 3.1 /100 | #231 | Tragic 6.4% |
| Assyrians/Chaldeans/Syriacs | 2.4 /100 | #232 | Tragic 6.4% |
| Sub-Saharan Africans | 2.3 /100 | #233 | Tragic 6.4% |
| Immigrants | Liberia | 2.3 /100 | #234 | Tragic 6.4% |
| Hispanics or Latinos | 2.2 /100 | #235 | Tragic 6.4% |
| Dutch | 2.0 /100 | #236 | Tragic 6.4% |
| Immigrants | Germany | 1.8 /100 | #237 | Tragic 6.4% |
| Haitians | 1.8 /100 | #238 | Tragic 6.4% |
Demographics Similar to Carpatho Rusyns by Ambulatory Disability
In terms of ambulatory disability, the demographic groups most similar to Carpatho Rusyns are European (6.2%, a difference of 0.050%), British (6.2%, a difference of 0.060%), Ukrainian (6.2%, a difference of 0.080%), Immigrants from Bosnia and Herzegovina (6.2%, a difference of 0.11%), and Immigrants from Western Africa (6.2%, a difference of 0.12%).
| Demographics | Rating | Rank | Ambulatory Disability |
| Immigrants | Nicaragua | 43.9 /100 | #180 | Average 6.1% |
| Swiss | 43.1 /100 | #181 | Average 6.1% |
| Serbians | 42.8 /100 | #182 | Average 6.1% |
| Immigrants | Thailand | 42.2 /100 | #183 | Average 6.1% |
| Immigrants | Ghana | 41.2 /100 | #184 | Average 6.1% |
| Immigrants | Bosnia and Herzegovina | 37.2 /100 | #185 | Fair 6.2% |
| Europeans | 36.2 /100 | #186 | Fair 6.2% |
| Carpatho Rusyns | 35.3 /100 | #187 | Fair 6.2% |
| British | 34.3 /100 | #188 | Fair 6.2% |
| Ukrainians | 34.0 /100 | #189 | Fair 6.2% |
| Immigrants | Western Africa | 33.4 /100 | #190 | Fair 6.2% |
| Immigrants | Guatemala | 31.9 /100 | #191 | Fair 6.2% |
| Immigrants | Western Europe | 31.6 /100 | #192 | Fair 6.2% |
| Guatemalans | 30.0 /100 | #193 | Fair 6.2% |
| Alaska Natives | 29.8 /100 | #194 | Fair 6.2% |