Immigrants from El Salvador vs Immigrants from Grenada Cognitive Disability
COMPARE
Immigrants from El Salvador
Immigrants from Grenada
Cognitive Disability
Cognitive Disability Comparison
Immigrants from El Salvador
Immigrants from Grenada
17.6%
COGNITIVE DISABILITY
7.0/ 100
METRIC RATING
214th/ 347
METRIC RANK
17.9%
COGNITIVE DISABILITY
0.6/ 100
METRIC RATING
252nd/ 347
METRIC RANK
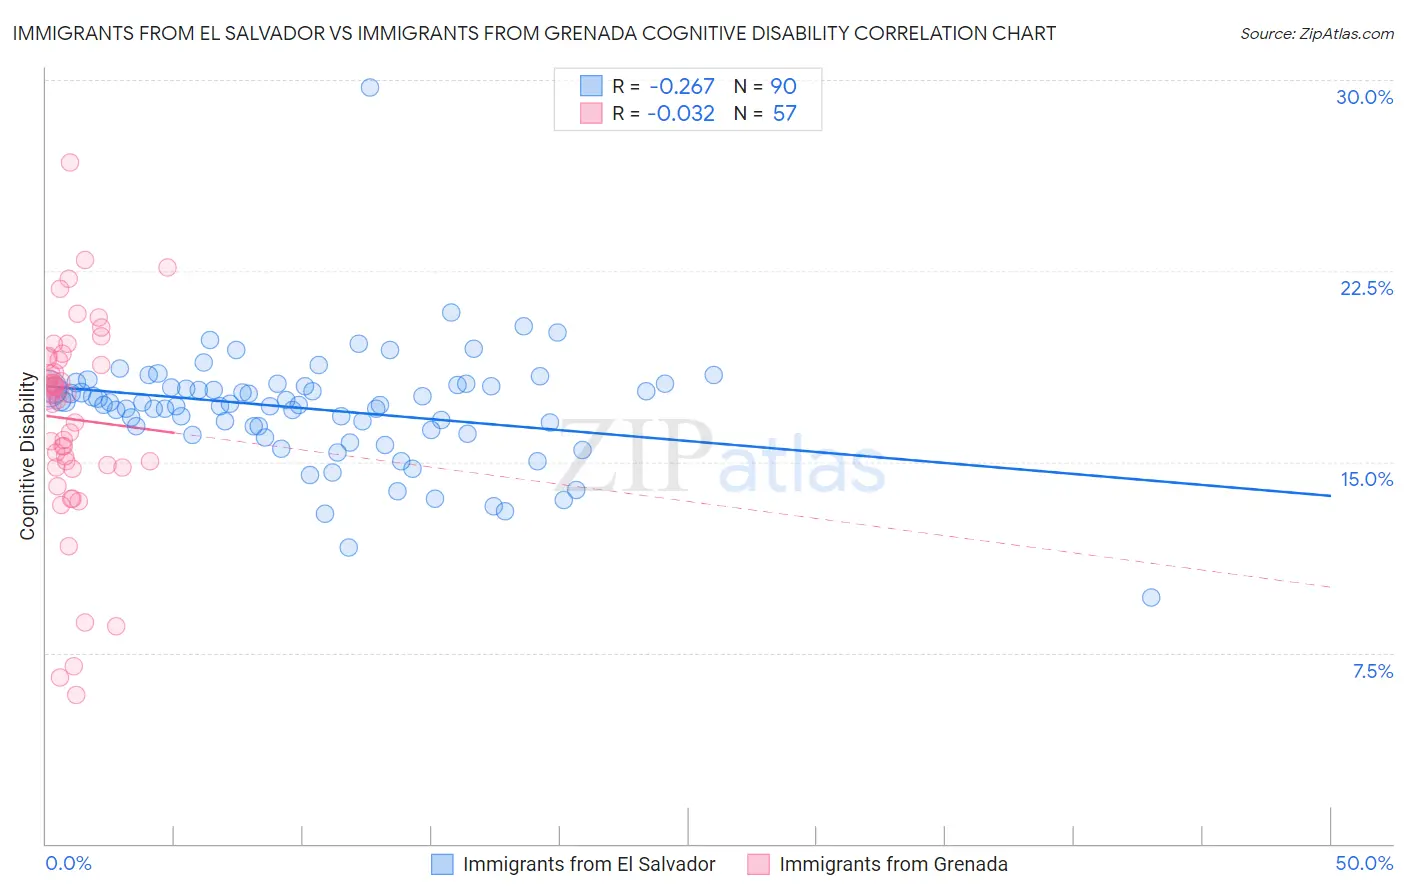
Immigrants from El Salvador vs Immigrants from Grenada Cognitive Disability Correlation Chart
The statistical analysis conducted on geographies consisting of 357,776,570 people shows a weak negative correlation between the proportion of Immigrants from El Salvador and percentage of population with cognitive disability in the United States with a correlation coefficient (R) of -0.267 and weighted average of 17.6%. Similarly, the statistical analysis conducted on geographies consisting of 67,189,782 people shows no correlation between the proportion of Immigrants from Grenada and percentage of population with cognitive disability in the United States with a correlation coefficient (R) of -0.032 and weighted average of 17.9%, a difference of 1.7%.
Cognitive Disability Correlation Summary
| Measurement | Immigrants from El Salvador | Immigrants from Grenada |
| Minimum | 9.6% | 5.9% |
| Maximum | 29.7% | 26.8% |
| Range | 20.0% | 20.9% |
| Mean | 17.1% | 16.7% |
| Median | 17.3% | 17.7% |
| Interquartile 25% (IQ1) | 16.2% | 14.8% |
| Interquartile 75% (IQ3) | 18.0% | 19.0% |
| Interquartile Range (IQR) | 1.7% | 4.2% |
| Standard Deviation (Sample) | 2.3% | 4.0% |
| Standard Deviation (Population) | 2.3% | 4.0% |
Similar Demographics by Cognitive Disability
Demographics Similar to Immigrants from El Salvador by Cognitive Disability
In terms of cognitive disability, the demographic groups most similar to Immigrants from El Salvador are Alaskan Athabascan (17.6%, a difference of 0.010%), Hawaiian (17.6%, a difference of 0.020%), Okinawan (17.6%, a difference of 0.020%), Salvadoran (17.6%, a difference of 0.030%), and Immigrants from Oceania (17.6%, a difference of 0.040%).
| Demographics | Rating | Rank | Cognitive Disability |
| Immigrants | Latin America | 9.7 /100 | #207 | Tragic 17.6% |
| Immigrants | Cameroon | 9.3 /100 | #208 | Tragic 17.6% |
| Immigrants | Trinidad and Tobago | 8.7 /100 | #209 | Tragic 17.6% |
| Immigrants | Jamaica | 8.5 /100 | #210 | Tragic 17.6% |
| Taiwanese | 7.7 /100 | #211 | Tragic 17.6% |
| Immigrants | Oceania | 7.3 /100 | #212 | Tragic 17.6% |
| Hawaiians | 7.2 /100 | #213 | Tragic 17.6% |
| Immigrants | El Salvador | 7.0 /100 | #214 | Tragic 17.6% |
| Alaskan Athabascans | 6.9 /100 | #215 | Tragic 17.6% |
| Okinawans | 6.8 /100 | #216 | Tragic 17.6% |
| Salvadorans | 6.7 /100 | #217 | Tragic 17.6% |
| Icelanders | 6.4 /100 | #218 | Tragic 17.6% |
| Immigrants | Sierra Leone | 6.3 /100 | #219 | Tragic 17.6% |
| Zimbabweans | 6.1 /100 | #220 | Tragic 17.6% |
| Moroccans | 5.9 /100 | #221 | Tragic 17.6% |
Demographics Similar to Immigrants from Grenada by Cognitive Disability
In terms of cognitive disability, the demographic groups most similar to Immigrants from Grenada are Malaysian (17.9%, a difference of 0.010%), Hopi (17.9%, a difference of 0.010%), Cree (17.9%, a difference of 0.020%), Immigrants from Ethiopia (17.9%, a difference of 0.020%), and Hispanic or Latino (17.9%, a difference of 0.020%).
| Demographics | Rating | Rank | Cognitive Disability |
| Trinidadians and Tobagonians | 0.8 /100 | #245 | Tragic 17.9% |
| Immigrants | Thailand | 0.8 /100 | #246 | Tragic 17.9% |
| Samoans | 0.7 /100 | #247 | Tragic 17.9% |
| French American Indians | 0.7 /100 | #248 | Tragic 17.9% |
| Cree | 0.7 /100 | #249 | Tragic 17.9% |
| Immigrants | Ethiopia | 0.7 /100 | #250 | Tragic 17.9% |
| Malaysians | 0.6 /100 | #251 | Tragic 17.9% |
| Immigrants | Grenada | 0.6 /100 | #252 | Tragic 17.9% |
| Hopi | 0.6 /100 | #253 | Tragic 17.9% |
| Hispanics or Latinos | 0.6 /100 | #254 | Tragic 17.9% |
| Immigrants | Azores | 0.6 /100 | #255 | Tragic 17.9% |
| Bahamians | 0.6 /100 | #256 | Tragic 17.9% |
| Mexican American Indians | 0.6 /100 | #257 | Tragic 17.9% |
| Immigrants | Armenia | 0.6 /100 | #258 | Tragic 17.9% |
| Ethiopians | 0.5 /100 | #259 | Tragic 17.9% |