Immigrants from China vs Immigrants from Bangladesh Cognitive Disability
COMPARE
Immigrants from China
Immigrants from Bangladesh
Cognitive Disability
Cognitive Disability Comparison
Immigrants from China
Immigrants from Bangladesh
16.9%
COGNITIVE DISABILITY
94.9/ 100
METRIC RATING
121st/ 347
METRIC RANK
17.8%
COGNITIVE DISABILITY
1.0/ 100
METRIC RATING
243rd/ 347
METRIC RANK
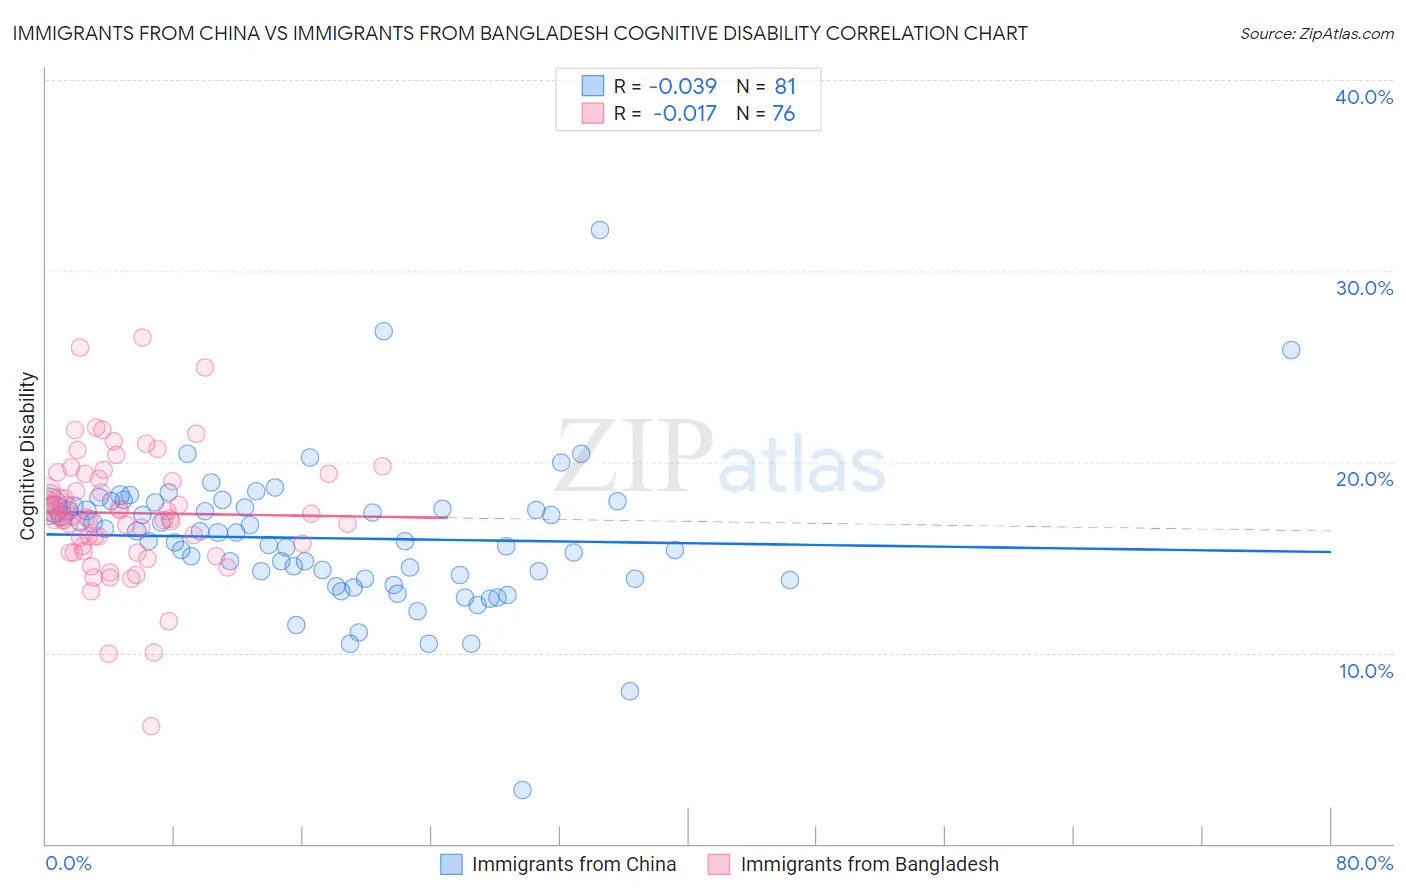
Immigrants from China vs Immigrants from Bangladesh Cognitive Disability Correlation Chart
The statistical analysis conducted on geographies consisting of 457,042,790 people shows no correlation between the proportion of Immigrants from China and percentage of population with cognitive disability in the United States with a correlation coefficient (R) of -0.039 and weighted average of 16.9%. Similarly, the statistical analysis conducted on geographies consisting of 203,670,223 people shows no correlation between the proportion of Immigrants from Bangladesh and percentage of population with cognitive disability in the United States with a correlation coefficient (R) of -0.017 and weighted average of 17.8%, a difference of 5.5%.
Cognitive Disability Correlation Summary
| Measurement | Immigrants from China | Immigrants from Bangladesh |
| Minimum | 2.8% | 6.2% |
| Maximum | 32.2% | 26.5% |
| Range | 29.4% | 20.3% |
| Mean | 16.0% | 17.3% |
| Median | 16.3% | 17.2% |
| Interquartile 25% (IQ1) | 13.9% | 15.6% |
| Interquartile 75% (IQ3) | 17.7% | 19.1% |
| Interquartile Range (IQR) | 3.8% | 3.4% |
| Standard Deviation (Sample) | 3.8% | 3.2% |
| Standard Deviation (Population) | 3.8% | 3.2% |
Similar Demographics by Cognitive Disability
Demographics Similar to Immigrants from China by Cognitive Disability
In terms of cognitive disability, the demographic groups most similar to Immigrants from China are Scottish (16.9%, a difference of 0.020%), Immigrants from Western Europe (16.9%, a difference of 0.020%), Portuguese (16.9%, a difference of 0.030%), Turkish (16.9%, a difference of 0.050%), and South African (16.9%, a difference of 0.10%).
| Demographics | Rating | Rank | Cognitive Disability |
| Koreans | 97.1 /100 | #114 | Exceptional 16.8% |
| Yup'ik | 96.9 /100 | #115 | Exceptional 16.9% |
| Inupiat | 96.5 /100 | #116 | Exceptional 16.9% |
| Immigrants | Japan | 96.2 /100 | #117 | Exceptional 16.9% |
| Immigrants | Denmark | 96.2 /100 | #118 | Exceptional 16.9% |
| South Africans | 95.5 /100 | #119 | Exceptional 16.9% |
| Scottish | 95.0 /100 | #120 | Exceptional 16.9% |
| Immigrants | China | 94.9 /100 | #121 | Exceptional 16.9% |
| Immigrants | Western Europe | 94.8 /100 | #122 | Exceptional 16.9% |
| Portuguese | 94.7 /100 | #123 | Exceptional 16.9% |
| Turks | 94.5 /100 | #124 | Exceptional 16.9% |
| Scandinavians | 94.1 /100 | #125 | Exceptional 16.9% |
| Europeans | 93.4 /100 | #126 | Exceptional 17.0% |
| Immigrants | Costa Rica | 93.1 /100 | #127 | Exceptional 17.0% |
| Nicaraguans | 93.0 /100 | #128 | Exceptional 17.0% |
Demographics Similar to Immigrants from Bangladesh by Cognitive Disability
In terms of cognitive disability, the demographic groups most similar to Immigrants from Bangladesh are Jamaican (17.9%, a difference of 0.040%), Paiute (17.8%, a difference of 0.070%), Mexican (17.8%, a difference of 0.090%), Trinidadian and Tobagonian (17.9%, a difference of 0.13%), and Immigrants from Thailand (17.9%, a difference of 0.15%).
| Demographics | Rating | Rank | Cognitive Disability |
| Immigrants | Iraq | 1.8 /100 | #236 | Tragic 17.8% |
| Immigrants | Mexico | 1.8 /100 | #237 | Tragic 17.8% |
| Cheyenne | 1.7 /100 | #238 | Tragic 17.8% |
| Cajuns | 1.4 /100 | #239 | Tragic 17.8% |
| Iraqis | 1.4 /100 | #240 | Tragic 17.8% |
| Mexicans | 1.1 /100 | #241 | Tragic 17.8% |
| Paiute | 1.1 /100 | #242 | Tragic 17.8% |
| Immigrants | Bangladesh | 1.0 /100 | #243 | Tragic 17.8% |
| Jamaicans | 0.9 /100 | #244 | Tragic 17.9% |
| Trinidadians and Tobagonians | 0.8 /100 | #245 | Tragic 17.9% |
| Immigrants | Thailand | 0.8 /100 | #246 | Tragic 17.9% |
| Samoans | 0.7 /100 | #247 | Tragic 17.9% |
| French American Indians | 0.7 /100 | #248 | Tragic 17.9% |
| Cree | 0.7 /100 | #249 | Tragic 17.9% |
| Immigrants | Ethiopia | 0.7 /100 | #250 | Tragic 17.9% |