Guamanian/Chamorro vs Alsatian Unemployment Among Women with Children Under 18 years
COMPARE
Guamanian/Chamorro
Alsatian
Unemployment Among Women with Children Under 18 years
Unemployment Among Women with Children Under 18 years Comparison
Guamanians/Chamorros
Alsatians
5.8%
UNEMPLOYMENT AMONG WOMEN WITH CHILDREN UNDER 18 YEARS
2.9/ 100
METRIC RATING
234th/ 347
METRIC RANK
5.8%
UNEMPLOYMENT AMONG WOMEN WITH CHILDREN UNDER 18 YEARS
2.5/ 100
METRIC RATING
236th/ 347
METRIC RANK
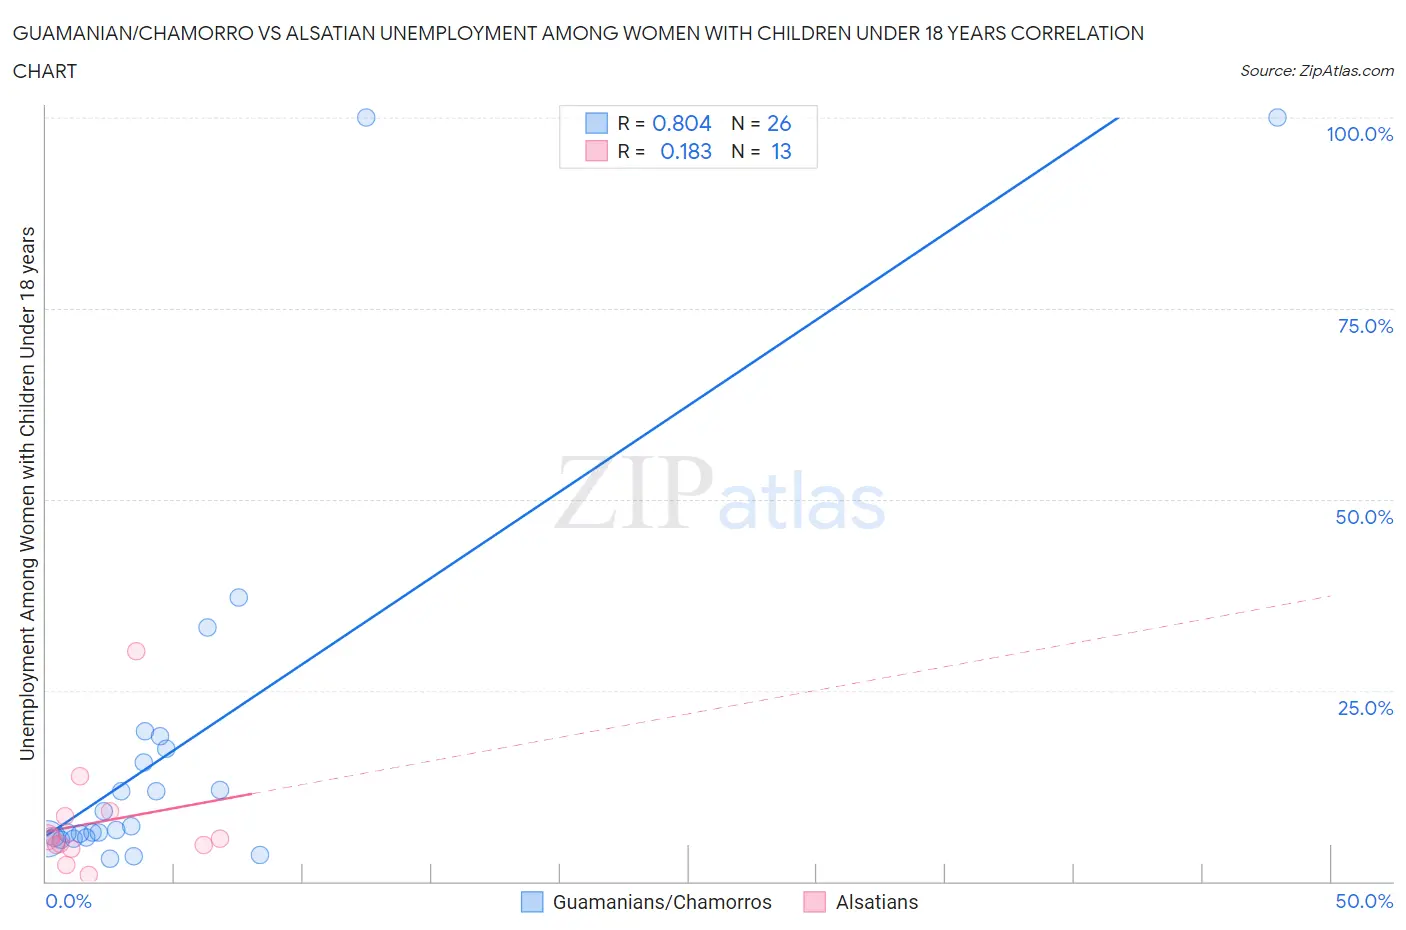
Guamanian/Chamorro vs Alsatian Unemployment Among Women with Children Under 18 years Correlation Chart
The statistical analysis conducted on geographies consisting of 217,637,806 people shows a very strong positive correlation between the proportion of Guamanians/Chamorros and unemployment rate among women with children under the age of 18 in the United States with a correlation coefficient (R) of 0.804 and weighted average of 5.8%. Similarly, the statistical analysis conducted on geographies consisting of 81,370,800 people shows a poor positive correlation between the proportion of Alsatians and unemployment rate among women with children under the age of 18 in the United States with a correlation coefficient (R) of 0.183 and weighted average of 5.8%, a difference of 0.21%.
Unemployment Among Women with Children Under 18 years Correlation Summary
| Measurement | Guamanian/Chamorro | Alsatian |
| Minimum | 3.0% | 0.90% |
| Maximum | 100.0% | 30.1% |
| Range | 97.0% | 29.2% |
| Mean | 17.8% | 7.7% |
| Median | 6.9% | 5.6% |
| Interquartile 25% (IQ1) | 5.8% | 4.5% |
| Interquartile 75% (IQ3) | 17.3% | 8.8% |
| Interquartile Range (IQR) | 11.5% | 4.3% |
| Standard Deviation (Sample) | 25.7% | 7.5% |
| Standard Deviation (Population) | 25.2% | 7.2% |
Demographics Similar to Guamanians/Chamorros and Alsatians by Unemployment Among Women with Children Under 18 years
In terms of unemployment among women with children under 18 years, the demographic groups most similar to Guamanians/Chamorros are Immigrants from Middle Africa (5.8%, a difference of 0.040%), Spanish American (5.8%, a difference of 0.11%), Creek (5.8%, a difference of 0.13%), Immigrants from Africa (5.8%, a difference of 0.15%), and Immigrants from South America (5.8%, a difference of 0.21%). Similarly, the demographic groups most similar to Alsatians are Immigrants from Lebanon (5.8%, a difference of 0.10%), Immigrants from Middle Africa (5.8%, a difference of 0.17%), Immigrants from Somalia (5.8%, a difference of 0.28%), Spanish American (5.8%, a difference of 0.32%), and Creek (5.8%, a difference of 0.33%).
| Demographics | Rating | Rank | Unemployment Among Women with Children Under 18 years |
| Armenians | 4.5 /100 | #225 | Tragic 5.7% |
| Cherokee | 4.3 /100 | #226 | Tragic 5.7% |
| Sierra Leoneans | 3.8 /100 | #227 | Tragic 5.8% |
| Somalis | 3.5 /100 | #228 | Tragic 5.8% |
| Immigrants | Panama | 3.4 /100 | #229 | Tragic 5.8% |
| Immigrants | South America | 3.2 /100 | #230 | Tragic 5.8% |
| Immigrants | Africa | 3.1 /100 | #231 | Tragic 5.8% |
| Creek | 3.1 /100 | #232 | Tragic 5.8% |
| Spanish Americans | 3.1 /100 | #233 | Tragic 5.8% |
| Guamanians/Chamorros | 2.9 /100 | #234 | Tragic 5.8% |
| Immigrants | Middle Africa | 2.8 /100 | #235 | Tragic 5.8% |
| Alsatians | 2.5 /100 | #236 | Tragic 5.8% |
| Immigrants | Lebanon | 2.4 /100 | #237 | Tragic 5.8% |
| Immigrants | Somalia | 2.2 /100 | #238 | Tragic 5.8% |
| Immigrants | Sierra Leone | 2.0 /100 | #239 | Tragic 5.8% |
| Immigrants | Immigrants | 2.0 /100 | #240 | Tragic 5.8% |
| Brazilians | 1.6 /100 | #241 | Tragic 5.8% |
| Moroccans | 1.4 /100 | #242 | Tragic 5.9% |
| Immigrants | Uruguay | 1.1 /100 | #243 | Tragic 5.9% |
| Choctaw | 1.1 /100 | #244 | Tragic 5.9% |
| Ugandans | 1.1 /100 | #245 | Tragic 5.9% |