Immigrants from Guatemala vs Alsatian Vision Disability
COMPARE
Immigrants from Guatemala
Alsatian
Vision Disability
Vision Disability Comparison
Immigrants from Guatemala
Alsatians
2.4%
VISION DISABILITY
0.3/ 100
METRIC RATING
255th/ 347
METRIC RANK
2.3%
VISION DISABILITY
0.6/ 100
METRIC RATING
245th/ 347
METRIC RANK
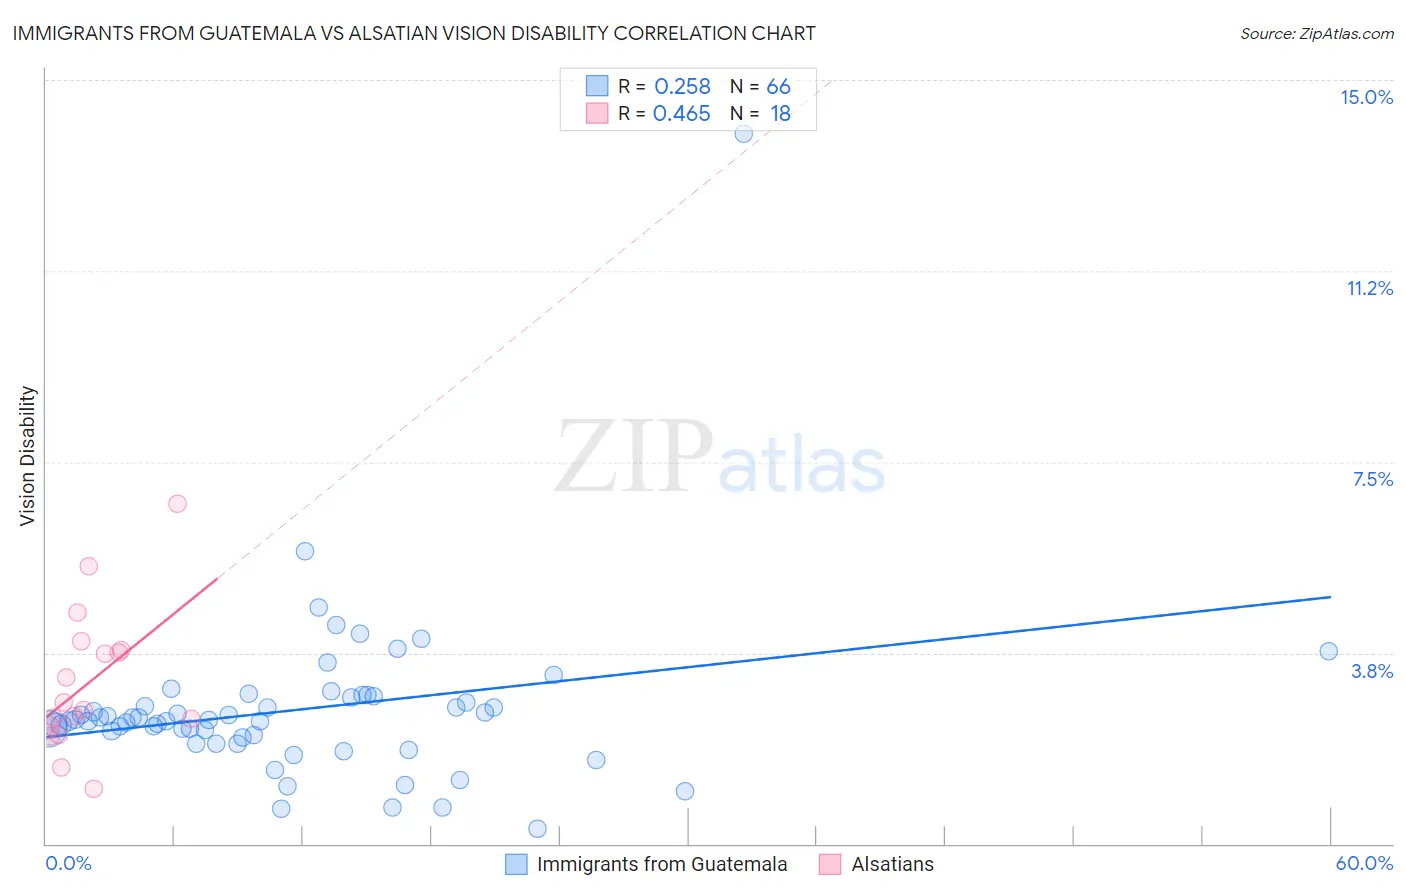
Immigrants from Guatemala vs Alsatian Vision Disability Correlation Chart
The statistical analysis conducted on geographies consisting of 377,092,792 people shows a weak positive correlation between the proportion of Immigrants from Guatemala and percentage of population with vision disability in the United States with a correlation coefficient (R) of 0.258 and weighted average of 2.4%. Similarly, the statistical analysis conducted on geographies consisting of 82,677,708 people shows a moderate positive correlation between the proportion of Alsatians and percentage of population with vision disability in the United States with a correlation coefficient (R) of 0.465 and weighted average of 2.3%, a difference of 1.1%.
Vision Disability Correlation Summary
| Measurement | Immigrants from Guatemala | Alsatian |
| Minimum | 0.29% | 1.1% |
| Maximum | 14.0% | 6.7% |
| Range | 13.7% | 5.6% |
| Mean | 2.6% | 3.2% |
| Median | 2.4% | 2.7% |
| Interquartile 25% (IQ1) | 2.1% | 2.3% |
| Interquartile 75% (IQ3) | 2.9% | 3.8% |
| Interquartile Range (IQR) | 0.78% | 1.5% |
| Standard Deviation (Sample) | 1.7% | 1.4% |
| Standard Deviation (Population) | 1.7% | 1.4% |
Demographics Similar to Immigrants from Guatemala and Alsatians by Vision Disability
In terms of vision disability, the demographic groups most similar to Immigrants from Guatemala are Haitian (2.4%, a difference of 0.030%), Japanese (2.4%, a difference of 0.31%), Immigrants from Haiti (2.4%, a difference of 0.33%), Immigrants from Micronesia (2.4%, a difference of 0.38%), and West Indian (2.4%, a difference of 0.40%). Similarly, the demographic groups most similar to Alsatians are Immigrants from Nicaragua (2.3%, a difference of 0.090%), Immigrants from West Indies (2.3%, a difference of 0.090%), French (2.3%, a difference of 0.15%), Guatemalan (2.3%, a difference of 0.19%), and Subsaharan African (2.3%, a difference of 0.21%).
| Demographics | Rating | Rank | Vision Disability |
| Panamanians | 0.9 /100 | #240 | Tragic 2.3% |
| Malaysians | 0.9 /100 | #241 | Tragic 2.3% |
| Immigrants | Panama | 0.8 /100 | #242 | Tragic 2.3% |
| Immigrants | Nicaragua | 0.6 /100 | #243 | Tragic 2.3% |
| Immigrants | West Indies | 0.6 /100 | #244 | Tragic 2.3% |
| Alsatians | 0.6 /100 | #245 | Tragic 2.3% |
| French | 0.5 /100 | #246 | Tragic 2.3% |
| Guatemalans | 0.5 /100 | #247 | Tragic 2.3% |
| Sub-Saharan Africans | 0.5 /100 | #248 | Tragic 2.3% |
| Liberians | 0.5 /100 | #249 | Tragic 2.3% |
| Bangladeshis | 0.5 /100 | #250 | Tragic 2.3% |
| Immigrants | Laos | 0.4 /100 | #251 | Tragic 2.4% |
| Immigrants | Micronesia | 0.3 /100 | #252 | Tragic 2.4% |
| Japanese | 0.3 /100 | #253 | Tragic 2.4% |
| Haitians | 0.3 /100 | #254 | Tragic 2.4% |
| Immigrants | Guatemala | 0.3 /100 | #255 | Tragic 2.4% |
| Immigrants | Haiti | 0.2 /100 | #256 | Tragic 2.4% |
| West Indians | 0.2 /100 | #257 | Tragic 2.4% |
| British West Indians | 0.2 /100 | #258 | Tragic 2.4% |
| Whites/Caucasians | 0.2 /100 | #259 | Tragic 2.4% |
| Belizeans | 0.2 /100 | #260 | Tragic 2.4% |