Yup'ik vs Alsatian Vision Disability
COMPARE
Yup'ik
Alsatian
Vision Disability
Vision Disability Comparison
Yup'ik
Alsatians
2.7%
VISION DISABILITY
0.0/ 100
METRIC RATING
317th/ 347
METRIC RANK
2.3%
VISION DISABILITY
0.6/ 100
METRIC RATING
245th/ 347
METRIC RANK
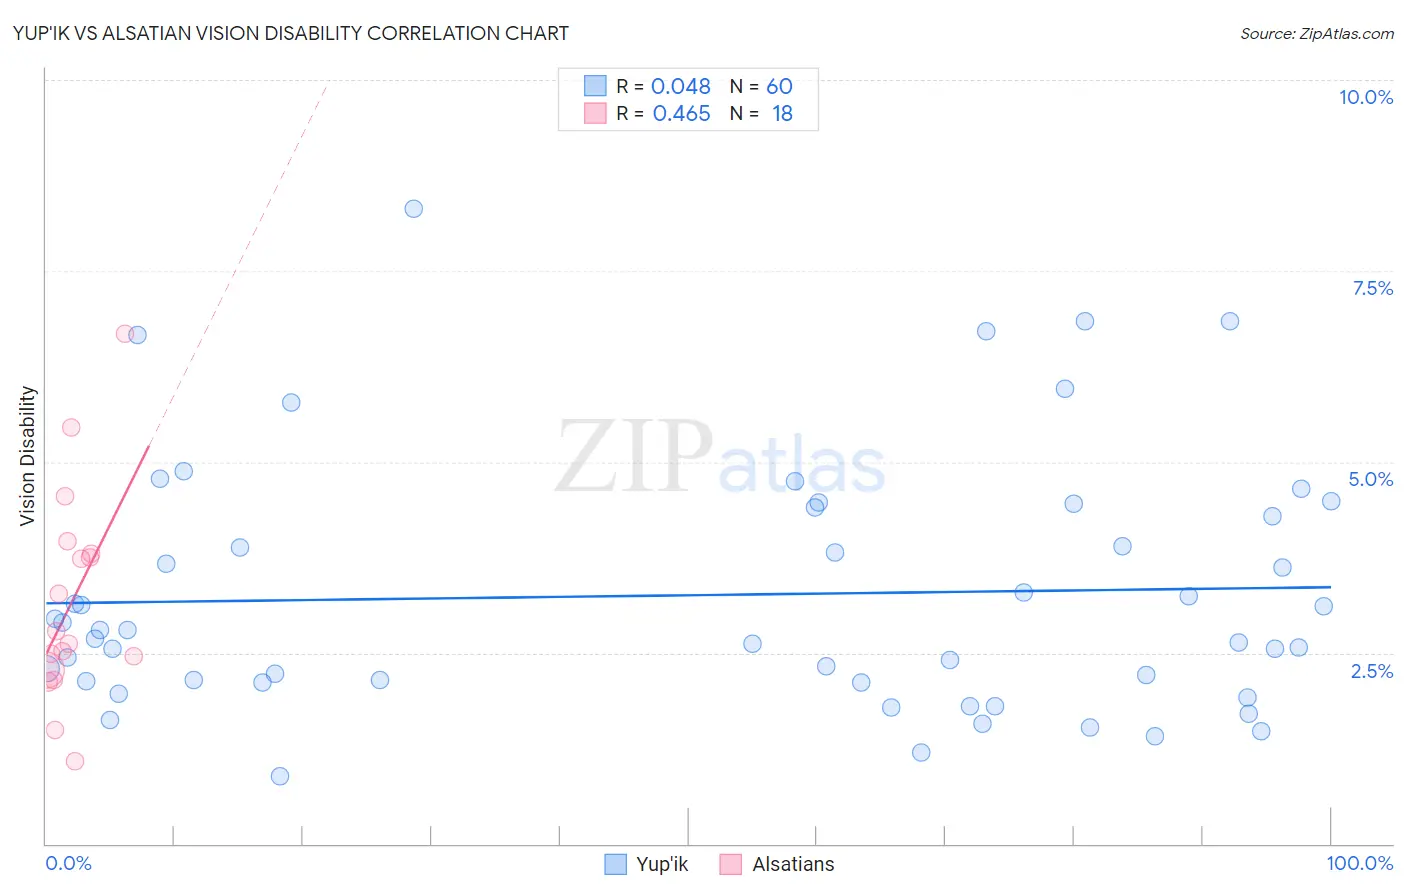
Yup'ik vs Alsatian Vision Disability Correlation Chart
The statistical analysis conducted on geographies consisting of 39,951,250 people shows no correlation between the proportion of Yup'ik and percentage of population with vision disability in the United States with a correlation coefficient (R) of 0.048 and weighted average of 2.7%. Similarly, the statistical analysis conducted on geographies consisting of 82,677,708 people shows a moderate positive correlation between the proportion of Alsatians and percentage of population with vision disability in the United States with a correlation coefficient (R) of 0.465 and weighted average of 2.3%, a difference of 15.2%.
Vision Disability Correlation Summary
| Measurement | Yup'ik | Alsatian |
| Minimum | 0.88% | 1.1% |
| Maximum | 8.3% | 6.7% |
| Range | 7.4% | 5.6% |
| Mean | 3.3% | 3.2% |
| Median | 2.7% | 2.7% |
| Interquartile 25% (IQ1) | 2.1% | 2.3% |
| Interquartile 75% (IQ3) | 4.3% | 3.8% |
| Interquartile Range (IQR) | 2.2% | 1.5% |
| Standard Deviation (Sample) | 1.6% | 1.4% |
| Standard Deviation (Population) | 1.6% | 1.4% |
Similar Demographics by Vision Disability
Demographics Similar to Yup'ik by Vision Disability
In terms of vision disability, the demographic groups most similar to Yup'ik are Shoshone (2.7%, a difference of 0.20%), Osage (2.7%, a difference of 0.63%), Alaska Native (2.7%, a difference of 1.1%), Inupiat (2.7%, a difference of 1.8%), and Potawatomi (2.6%, a difference of 1.9%).
| Demographics | Rating | Rank | Vision Disability |
| Blackfeet | 0.0 /100 | #310 | Tragic 2.6% |
| Dominicans | 0.0 /100 | #311 | Tragic 2.6% |
| Americans | 0.0 /100 | #312 | Tragic 2.6% |
| Potawatomi | 0.0 /100 | #313 | Tragic 2.6% |
| Inupiat | 0.0 /100 | #314 | Tragic 2.7% |
| Osage | 0.0 /100 | #315 | Tragic 2.7% |
| Shoshone | 0.0 /100 | #316 | Tragic 2.7% |
| Yup'ik | 0.0 /100 | #317 | Tragic 2.7% |
| Alaska Natives | 0.0 /100 | #318 | Tragic 2.7% |
| Tohono O'odham | 0.0 /100 | #319 | Tragic 2.8% |
| Blacks/African Americans | 0.0 /100 | #320 | Tragic 2.8% |
| Comanche | 0.0 /100 | #321 | Tragic 2.8% |
| Paiute | 0.0 /100 | #322 | Tragic 2.9% |
| Tlingit-Haida | 0.0 /100 | #323 | Tragic 2.9% |
| Hopi | 0.0 /100 | #324 | Tragic 2.9% |
Demographics Similar to Alsatians by Vision Disability
In terms of vision disability, the demographic groups most similar to Alsatians are Immigrants from Nicaragua (2.3%, a difference of 0.090%), Immigrants from West Indies (2.3%, a difference of 0.090%), French (2.3%, a difference of 0.15%), Guatemalan (2.3%, a difference of 0.19%), and Subsaharan African (2.3%, a difference of 0.21%).
| Demographics | Rating | Rank | Vision Disability |
| Immigrants | Cambodia | 1.1 /100 | #238 | Tragic 2.3% |
| English | 1.1 /100 | #239 | Tragic 2.3% |
| Panamanians | 0.9 /100 | #240 | Tragic 2.3% |
| Malaysians | 0.9 /100 | #241 | Tragic 2.3% |
| Immigrants | Panama | 0.8 /100 | #242 | Tragic 2.3% |
| Immigrants | Nicaragua | 0.6 /100 | #243 | Tragic 2.3% |
| Immigrants | West Indies | 0.6 /100 | #244 | Tragic 2.3% |
| Alsatians | 0.6 /100 | #245 | Tragic 2.3% |
| French | 0.5 /100 | #246 | Tragic 2.3% |
| Guatemalans | 0.5 /100 | #247 | Tragic 2.3% |
| Sub-Saharan Africans | 0.5 /100 | #248 | Tragic 2.3% |
| Liberians | 0.5 /100 | #249 | Tragic 2.3% |
| Bangladeshis | 0.5 /100 | #250 | Tragic 2.3% |
| Immigrants | Laos | 0.4 /100 | #251 | Tragic 2.4% |
| Immigrants | Micronesia | 0.3 /100 | #252 | Tragic 2.4% |