Immigrants from the Azores vs Immigrants from Canada Male Disability
COMPARE
Immigrants from the Azores
Immigrants from Canada
Male Disability
Male Disability Comparison
Immigrants from the Azores
Immigrants from Canada
13.4%
MALE DISABILITY
0.0/ 100
METRIC RATING
310th/ 347
METRIC RANK
11.9%
MALE DISABILITY
1.6/ 100
METRIC RATING
234th/ 347
METRIC RANK
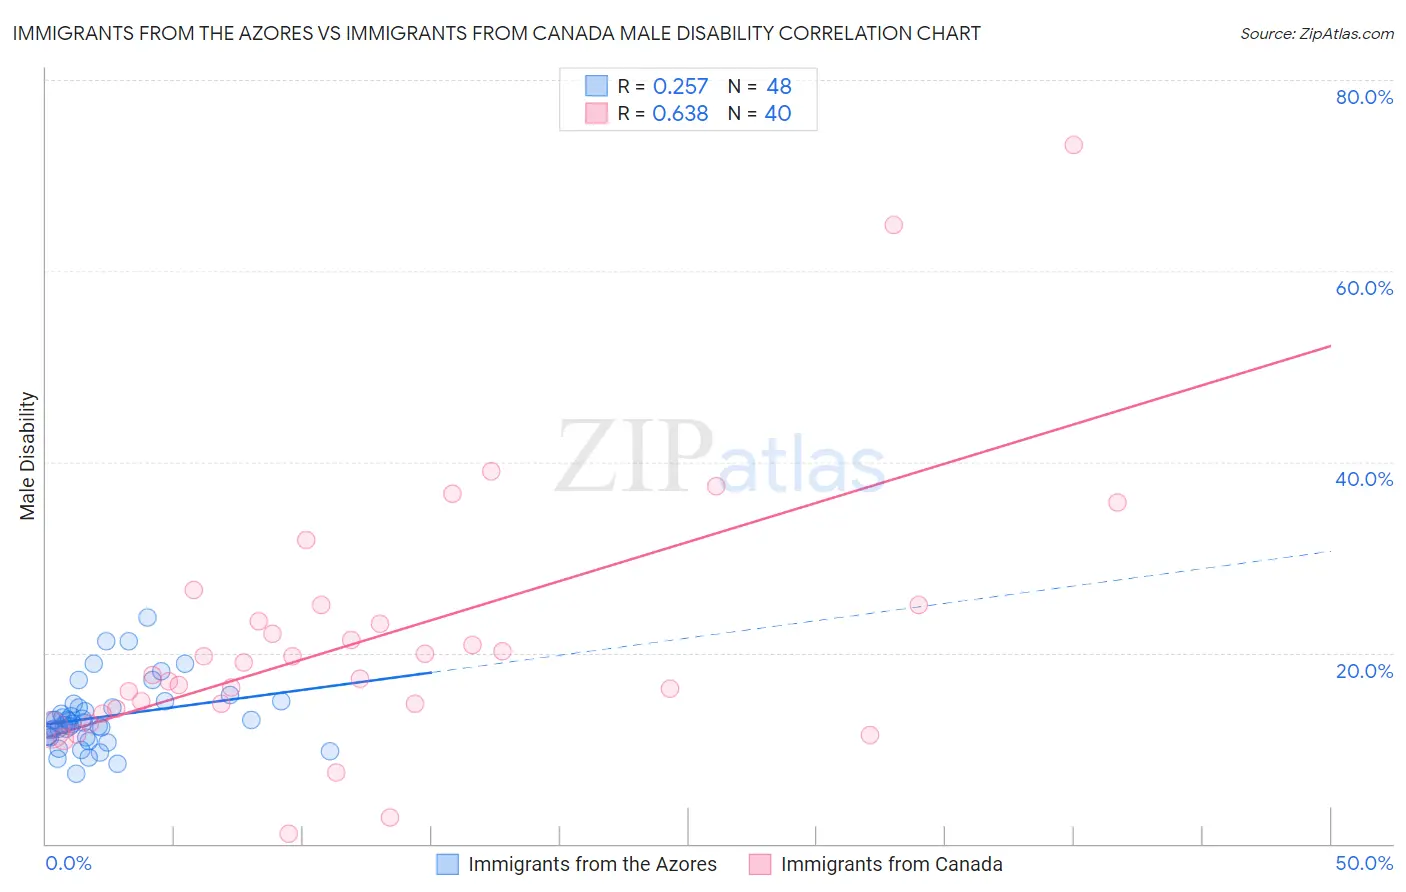
Immigrants from the Azores vs Immigrants from Canada Male Disability Correlation Chart
The statistical analysis conducted on geographies consisting of 46,257,178 people shows a weak positive correlation between the proportion of Immigrants from the Azores and percentage of males with a disability in the United States with a correlation coefficient (R) of 0.257 and weighted average of 13.4%. Similarly, the statistical analysis conducted on geographies consisting of 459,334,704 people shows a significant positive correlation between the proportion of Immigrants from Canada and percentage of males with a disability in the United States with a correlation coefficient (R) of 0.638 and weighted average of 11.9%, a difference of 13.4%.
Male Disability Correlation Summary
| Measurement | Immigrants from the Azores | Immigrants from Canada |
| Minimum | 7.4% | 1.0% |
| Maximum | 23.7% | 73.2% |
| Range | 16.3% | 72.2% |
| Mean | 13.3% | 21.6% |
| Median | 12.8% | 18.4% |
| Interquartile 25% (IQ1) | 11.2% | 14.4% |
| Interquartile 75% (IQ3) | 14.4% | 24.1% |
| Interquartile Range (IQR) | 3.2% | 9.8% |
| Standard Deviation (Sample) | 3.4% | 14.0% |
| Standard Deviation (Population) | 3.4% | 13.8% |
Similar Demographics by Male Disability
Demographics Similar to Immigrants from the Azores by Male Disability
In terms of male disability, the demographic groups most similar to Immigrants from the Azores are Blackfeet (13.4%, a difference of 0.14%), Delaware (13.5%, a difference of 0.19%), French American Indian (13.4%, a difference of 0.56%), Arapaho (13.3%, a difference of 0.72%), and Yakama (13.5%, a difference of 0.74%).
| Demographics | Rating | Rank | Male Disability |
| Scotch-Irish | 0.0 /100 | #303 | Tragic 13.2% |
| Blacks/African Americans | 0.0 /100 | #304 | Tragic 13.2% |
| French Canadians | 0.0 /100 | #305 | Tragic 13.3% |
| Spanish Americans | 0.0 /100 | #306 | Tragic 13.3% |
| Arapaho | 0.0 /100 | #307 | Tragic 13.3% |
| French American Indians | 0.0 /100 | #308 | Tragic 13.4% |
| Blackfeet | 0.0 /100 | #309 | Tragic 13.4% |
| Immigrants | Azores | 0.0 /100 | #310 | Tragic 13.4% |
| Delaware | 0.0 /100 | #311 | Tragic 13.5% |
| Yakama | 0.0 /100 | #312 | Tragic 13.5% |
| Puget Sound Salish | 0.0 /100 | #313 | Tragic 13.5% |
| Aleuts | 0.0 /100 | #314 | Tragic 13.5% |
| Iroquois | 0.0 /100 | #315 | Tragic 13.6% |
| Alaska Natives | 0.0 /100 | #316 | Tragic 13.6% |
| Paiute | 0.0 /100 | #317 | Tragic 13.7% |
Demographics Similar to Immigrants from Canada by Male Disability
In terms of male disability, the demographic groups most similar to Immigrants from Canada are Mexican (11.8%, a difference of 0.070%), Malaysian (11.8%, a difference of 0.11%), Immigrants from North America (11.9%, a difference of 0.13%), Dominican (11.8%, a difference of 0.18%), and U.S. Virgin Islander (11.9%, a difference of 0.26%).
| Demographics | Rating | Rank | Male Disability |
| Austrians | 2.5 /100 | #227 | Tragic 11.8% |
| Hispanics or Latinos | 2.3 /100 | #228 | Tragic 11.8% |
| Bermudans | 2.3 /100 | #229 | Tragic 11.8% |
| Croatians | 2.1 /100 | #230 | Tragic 11.8% |
| Dominicans | 1.8 /100 | #231 | Tragic 11.8% |
| Malaysians | 1.8 /100 | #232 | Tragic 11.8% |
| Mexicans | 1.7 /100 | #233 | Tragic 11.8% |
| Immigrants | Canada | 1.6 /100 | #234 | Tragic 11.9% |
| Immigrants | North America | 1.5 /100 | #235 | Tragic 11.9% |
| U.S. Virgin Islanders | 1.3 /100 | #236 | Tragic 11.9% |
| Carpatho Rusyns | 1.3 /100 | #237 | Tragic 11.9% |
| Yugoslavians | 1.2 /100 | #238 | Tragic 11.9% |
| Italians | 1.2 /100 | #239 | Tragic 11.9% |
| Czechs | 1.1 /100 | #240 | Tragic 11.9% |
| Bahamians | 1.1 /100 | #241 | Tragic 11.9% |