German vs Australian Cognitive Disability
COMPARE
German
Australian
Cognitive Disability
Cognitive Disability Comparison
Germans
Australians
16.7%
COGNITIVE DISABILITY
99.3/ 100
METRIC RATING
72nd/ 347
METRIC RANK
17.2%
COGNITIVE DISABILITY
72.4/ 100
METRIC RATING
160th/ 347
METRIC RANK
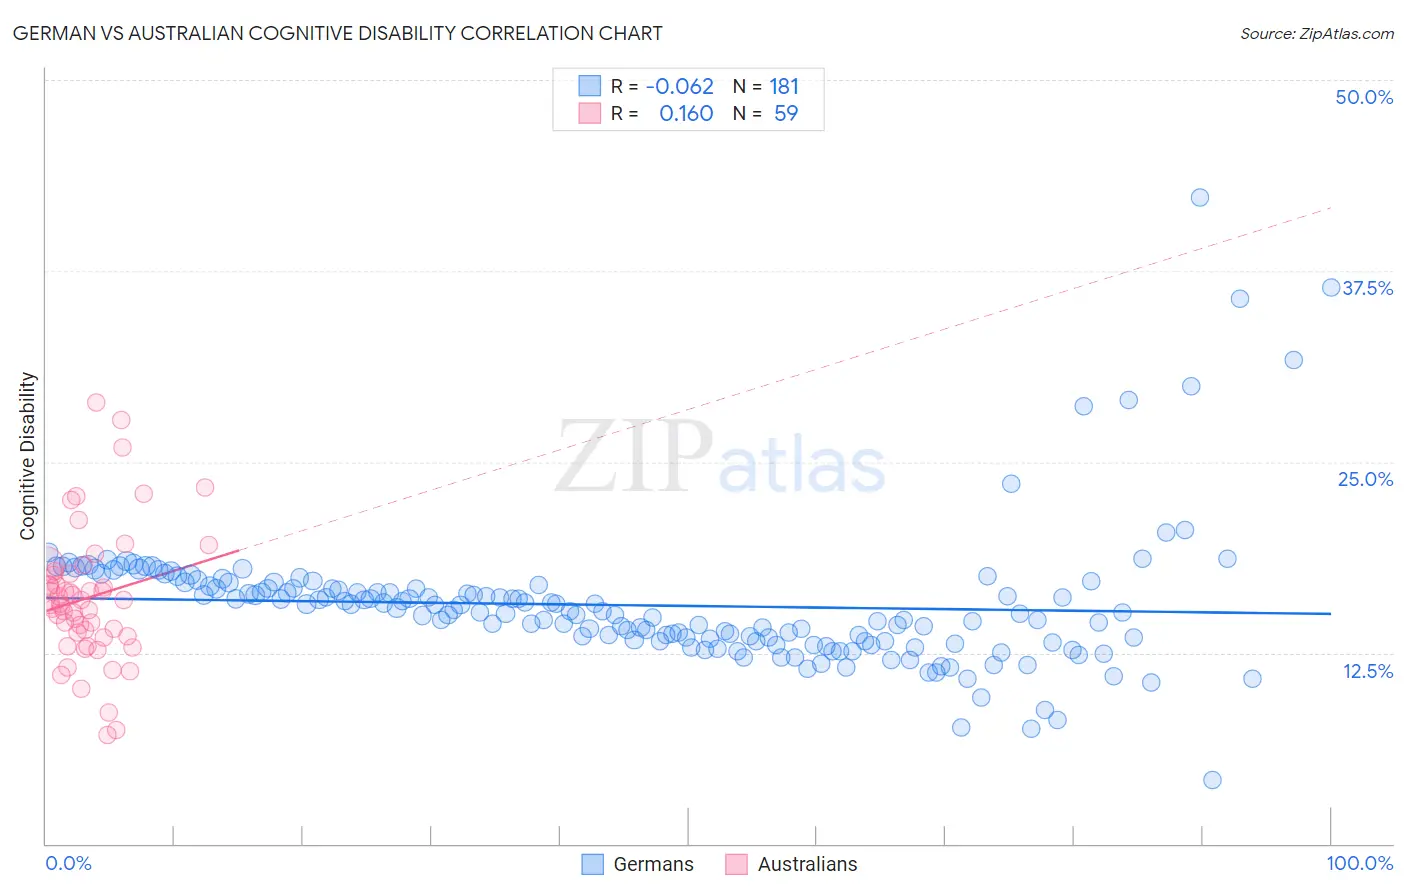
German vs Australian Cognitive Disability Correlation Chart
The statistical analysis conducted on geographies consisting of 580,999,229 people shows a slight negative correlation between the proportion of Germans and percentage of population with cognitive disability in the United States with a correlation coefficient (R) of -0.062 and weighted average of 16.7%. Similarly, the statistical analysis conducted on geographies consisting of 224,142,484 people shows a poor positive correlation between the proportion of Australians and percentage of population with cognitive disability in the United States with a correlation coefficient (R) of 0.160 and weighted average of 17.2%, a difference of 3.0%.
Cognitive Disability Correlation Summary
| Measurement | German | Australian |
| Minimum | 4.2% | 7.1% |
| Maximum | 42.3% | 28.9% |
| Range | 38.1% | 21.7% |
| Mean | 15.6% | 16.1% |
| Median | 15.2% | 15.7% |
| Interquartile 25% (IQ1) | 13.3% | 13.6% |
| Interquartile 75% (IQ3) | 16.9% | 17.7% |
| Interquartile Range (IQR) | 3.7% | 4.1% |
| Standard Deviation (Sample) | 4.5% | 4.3% |
| Standard Deviation (Population) | 4.5% | 4.3% |
Similar Demographics by Cognitive Disability
Demographics Similar to Germans by Cognitive Disability
In terms of cognitive disability, the demographic groups most similar to Germans are Burmese (16.7%, a difference of 0.010%), Slavic (16.7%, a difference of 0.010%), Immigrants from Sweden (16.7%, a difference of 0.020%), Immigrants from Belgium (16.7%, a difference of 0.020%), and Estonian (16.7%, a difference of 0.020%).
| Demographics | Rating | Rank | Cognitive Disability |
| Colombians | 99.6 /100 | #65 | Exceptional 16.6% |
| Immigrants | Ukraine | 99.5 /100 | #66 | Exceptional 16.6% |
| Latvians | 99.5 /100 | #67 | Exceptional 16.6% |
| Ukrainians | 99.4 /100 | #68 | Exceptional 16.6% |
| Immigrants | Uzbekistan | 99.4 /100 | #69 | Exceptional 16.7% |
| Immigrants | Sweden | 99.4 /100 | #70 | Exceptional 16.7% |
| Immigrants | Belgium | 99.3 /100 | #71 | Exceptional 16.7% |
| Germans | 99.3 /100 | #72 | Exceptional 16.7% |
| Burmese | 99.3 /100 | #73 | Exceptional 16.7% |
| Slavs | 99.3 /100 | #74 | Exceptional 16.7% |
| Estonians | 99.3 /100 | #75 | Exceptional 16.7% |
| Immigrants | Serbia | 99.3 /100 | #76 | Exceptional 16.7% |
| Immigrants | Hungary | 99.3 /100 | #77 | Exceptional 16.7% |
| Peruvians | 99.3 /100 | #78 | Exceptional 16.7% |
| Immigrants | Bulgaria | 99.3 /100 | #79 | Exceptional 16.7% |
Demographics Similar to Australians by Cognitive Disability
In terms of cognitive disability, the demographic groups most similar to Australians are American (17.2%, a difference of 0.010%), Immigrants from Latvia (17.2%, a difference of 0.030%), Yugoslavian (17.2%, a difference of 0.030%), Immigrants from Switzerland (17.2%, a difference of 0.030%), and Celtic (17.1%, a difference of 0.060%).
| Demographics | Rating | Rank | Cognitive Disability |
| Immigrants | Kazakhstan | 80.5 /100 | #153 | Excellent 17.1% |
| Immigrants | Malaysia | 79.3 /100 | #154 | Good 17.1% |
| Brazilians | 78.9 /100 | #155 | Good 17.1% |
| Sri Lankans | 78.9 /100 | #156 | Good 17.1% |
| Immigrants | Australia | 76.0 /100 | #157 | Good 17.1% |
| Celtics | 74.1 /100 | #158 | Good 17.1% |
| Immigrants | Latvia | 73.2 /100 | #159 | Good 17.2% |
| Australians | 72.4 /100 | #160 | Good 17.2% |
| Americans | 72.2 /100 | #161 | Good 17.2% |
| Yugoslavians | 71.6 /100 | #162 | Good 17.2% |
| Immigrants | Switzerland | 71.5 /100 | #163 | Good 17.2% |
| Armenians | 70.1 /100 | #164 | Good 17.2% |
| Immigrants | Albania | 64.9 /100 | #165 | Good 17.2% |
| Immigrants | Ecuador | 64.4 /100 | #166 | Good 17.2% |
| Immigrants | Syria | 63.5 /100 | #167 | Good 17.2% |