German Russian vs Hungarian Cognitive Disability
COMPARE
German Russian
Hungarian
Cognitive Disability
Cognitive Disability Comparison
German Russians
Hungarians
18.2%
COGNITIVE DISABILITY
0.0/ 100
METRIC RATING
295th/ 347
METRIC RANK
16.5%
COGNITIVE DISABILITY
99.9/ 100
METRIC RATING
42nd/ 347
METRIC RANK
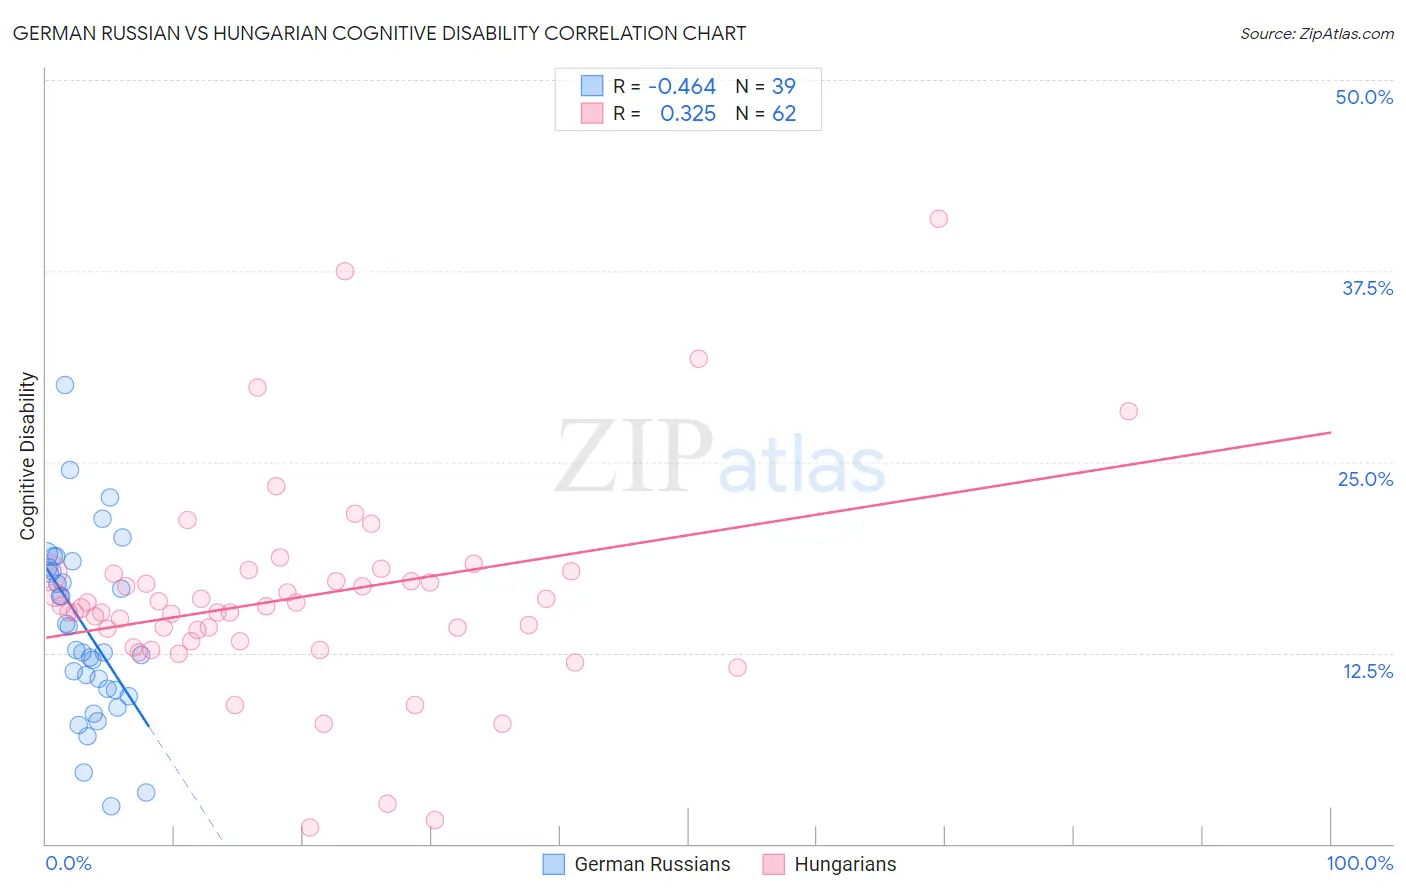
German Russian vs Hungarian Cognitive Disability Correlation Chart
The statistical analysis conducted on geographies consisting of 96,458,648 people shows a moderate negative correlation between the proportion of German Russians and percentage of population with cognitive disability in the United States with a correlation coefficient (R) of -0.464 and weighted average of 18.2%. Similarly, the statistical analysis conducted on geographies consisting of 486,167,723 people shows a mild positive correlation between the proportion of Hungarians and percentage of population with cognitive disability in the United States with a correlation coefficient (R) of 0.325 and weighted average of 16.5%, a difference of 10.7%.
Cognitive Disability Correlation Summary
| Measurement | German Russian | Hungarian |
| Minimum | 2.5% | 1.0% |
| Maximum | 30.0% | 40.9% |
| Range | 27.6% | 39.9% |
| Mean | 14.0% | 16.1% |
| Median | 12.7% | 15.5% |
| Interquartile 25% (IQ1) | 10.0% | 13.3% |
| Interquartile 75% (IQ3) | 18.1% | 17.7% |
| Interquartile Range (IQR) | 8.0% | 4.4% |
| Standard Deviation (Sample) | 5.9% | 6.8% |
| Standard Deviation (Population) | 5.8% | 6.7% |
Similar Demographics by Cognitive Disability
Demographics Similar to German Russians by Cognitive Disability
In terms of cognitive disability, the demographic groups most similar to German Russians are Immigrants from Burma/Myanmar (18.2%, a difference of 0.020%), British West Indian (18.2%, a difference of 0.17%), Blackfeet (18.3%, a difference of 0.17%), Japanese (18.3%, a difference of 0.17%), and Ghanaian (18.3%, a difference of 0.20%).
| Demographics | Rating | Rank | Cognitive Disability |
| Immigrants | West Indies | 0.1 /100 | #288 | Tragic 18.1% |
| Natives/Alaskans | 0.1 /100 | #289 | Tragic 18.1% |
| Immigrants | Africa | 0.1 /100 | #290 | Tragic 18.1% |
| Ottawa | 0.1 /100 | #291 | Tragic 18.2% |
| Iroquois | 0.1 /100 | #292 | Tragic 18.2% |
| Central American Indians | 0.1 /100 | #293 | Tragic 18.2% |
| British West Indians | 0.1 /100 | #294 | Tragic 18.2% |
| German Russians | 0.0 /100 | #295 | Tragic 18.2% |
| Immigrants | Burma/Myanmar | 0.0 /100 | #296 | Tragic 18.2% |
| Blackfeet | 0.0 /100 | #297 | Tragic 18.3% |
| Japanese | 0.0 /100 | #298 | Tragic 18.3% |
| Ghanaians | 0.0 /100 | #299 | Tragic 18.3% |
| Creek | 0.0 /100 | #300 | Tragic 18.3% |
| Immigrants | Ghana | 0.0 /100 | #301 | Tragic 18.3% |
| Barbadians | 0.0 /100 | #302 | Tragic 18.3% |
Demographics Similar to Hungarians by Cognitive Disability
In terms of cognitive disability, the demographic groups most similar to Hungarians are Cuban (16.5%, a difference of 0.010%), Immigrants from Belarus (16.5%, a difference of 0.020%), Bolivian (16.5%, a difference of 0.030%), Immigrants from Canada (16.5%, a difference of 0.060%), and Macedonian (16.5%, a difference of 0.090%).
| Demographics | Rating | Rank | Cognitive Disability |
| Slovaks | 99.9 /100 | #35 | Exceptional 16.4% |
| Greeks | 99.9 /100 | #36 | Exceptional 16.4% |
| Slovenes | 99.9 /100 | #37 | Exceptional 16.5% |
| Immigrants | Eastern Europe | 99.9 /100 | #38 | Exceptional 16.5% |
| Bolivians | 99.9 /100 | #39 | Exceptional 16.5% |
| Immigrants | Belarus | 99.9 /100 | #40 | Exceptional 16.5% |
| Cubans | 99.9 /100 | #41 | Exceptional 16.5% |
| Hungarians | 99.9 /100 | #42 | Exceptional 16.5% |
| Immigrants | Canada | 99.8 /100 | #43 | Exceptional 16.5% |
| Macedonians | 99.8 /100 | #44 | Exceptional 16.5% |
| Immigrants | Europe | 99.8 /100 | #45 | Exceptional 16.5% |
| Immigrants | Colombia | 99.8 /100 | #46 | Exceptional 16.5% |
| Immigrants | Italy | 99.8 /100 | #47 | Exceptional 16.5% |
| Immigrants | North America | 99.8 /100 | #48 | Exceptional 16.5% |
| Iranians | 99.8 /100 | #49 | Exceptional 16.5% |