German Russian vs Immigrants from Latin America Hearing Disability
COMPARE
German Russian
Immigrants from Latin America
Hearing Disability
Hearing Disability Comparison
German Russians
Immigrants from Latin America
3.3%
HEARING DISABILITY
1.8/ 100
METRIC RATING
238th/ 347
METRIC RANK
2.8%
HEARING DISABILITY
90.5/ 100
METRIC RATING
115th/ 347
METRIC RANK
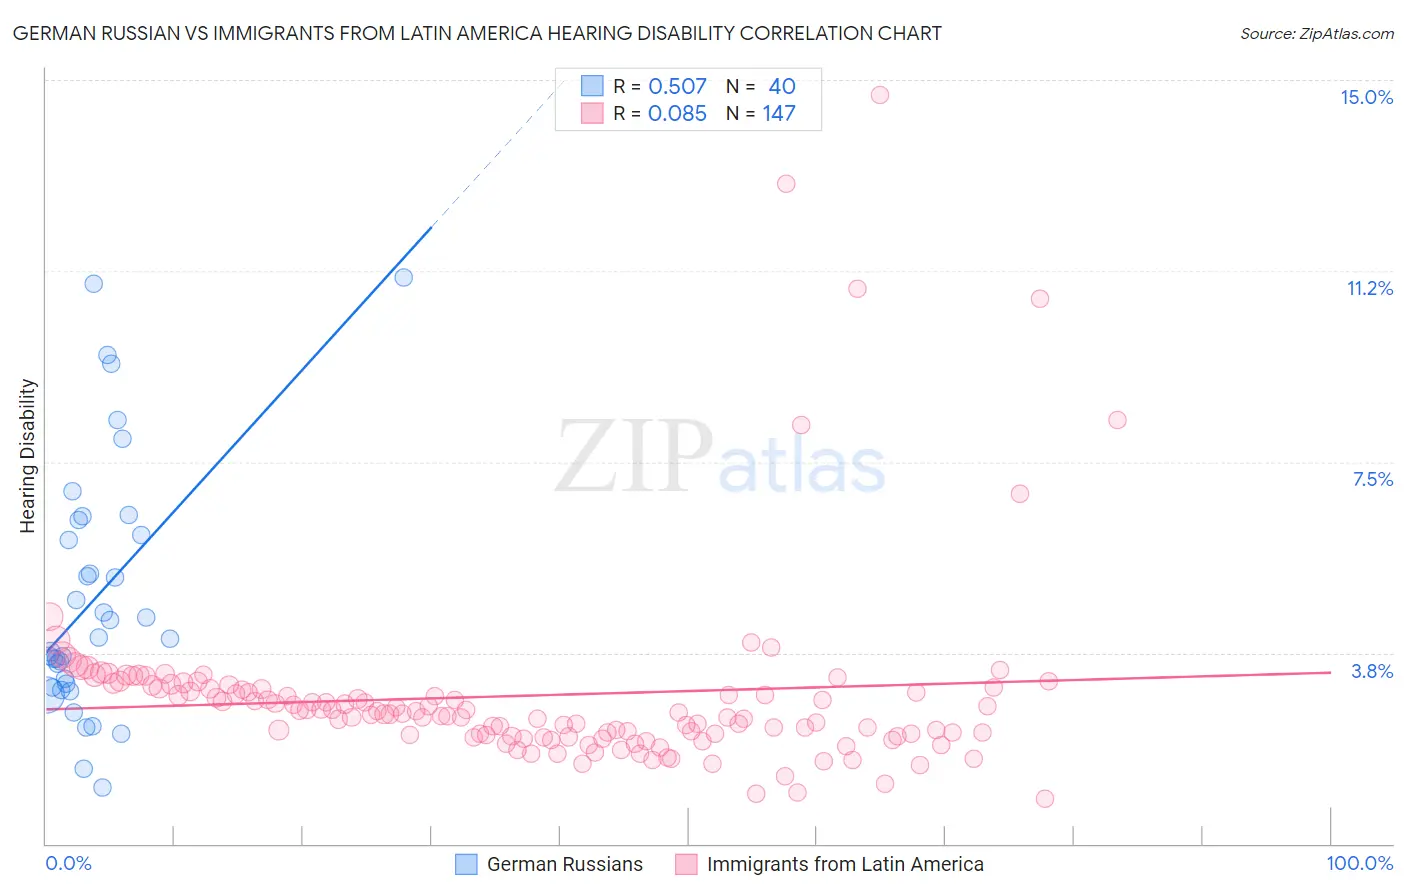
German Russian vs Immigrants from Latin America Hearing Disability Correlation Chart
The statistical analysis conducted on geographies consisting of 96,455,534 people shows a substantial positive correlation between the proportion of German Russians and percentage of population with hearing disability in the United States with a correlation coefficient (R) of 0.507 and weighted average of 3.3%. Similarly, the statistical analysis conducted on geographies consisting of 557,946,511 people shows a slight positive correlation between the proportion of Immigrants from Latin America and percentage of population with hearing disability in the United States with a correlation coefficient (R) of 0.085 and weighted average of 2.8%, a difference of 15.5%.
Hearing Disability Correlation Summary
| Measurement | German Russian | Immigrants from Latin America |
| Minimum | 1.1% | 0.89% |
| Maximum | 11.1% | 14.7% |
| Range | 10.0% | 13.8% |
| Mean | 4.8% | 2.9% |
| Median | 4.0% | 2.6% |
| Interquartile 25% (IQ1) | 3.1% | 2.1% |
| Interquartile 75% (IQ3) | 6.2% | 3.0% |
| Interquartile Range (IQR) | 3.1% | 0.94% |
| Standard Deviation (Sample) | 2.5% | 1.9% |
| Standard Deviation (Population) | 2.4% | 1.9% |
Similar Demographics by Hearing Disability
Demographics Similar to German Russians by Hearing Disability
In terms of hearing disability, the demographic groups most similar to German Russians are Immigrants from Austria (3.3%, a difference of 0.0%), Serbian (3.3%, a difference of 0.39%), Guamanian/Chamorro (3.3%, a difference of 0.46%), Central American Indian (3.3%, a difference of 0.56%), and Estonian (3.3%, a difference of 0.63%).
| Demographics | Rating | Rank | Hearing Disability |
| Luxembourgers | 2.9 /100 | #231 | Tragic 3.2% |
| Ukrainians | 2.9 /100 | #232 | Tragic 3.2% |
| Estonians | 2.4 /100 | #233 | Tragic 3.3% |
| Central American Indians | 2.3 /100 | #234 | Tragic 3.3% |
| Guamanians/Chamorros | 2.2 /100 | #235 | Tragic 3.3% |
| Serbians | 2.2 /100 | #236 | Tragic 3.3% |
| Immigrants | Austria | 1.8 /100 | #237 | Tragic 3.3% |
| German Russians | 1.8 /100 | #238 | Tragic 3.3% |
| Nepalese | 1.2 /100 | #239 | Tragic 3.3% |
| Immigrants | Netherlands | 1.1 /100 | #240 | Tragic 3.3% |
| Samoans | 1.1 /100 | #241 | Tragic 3.3% |
| Yugoslavians | 1.0 /100 | #242 | Tragic 3.3% |
| Immigrants | Western Europe | 1.0 /100 | #243 | Tragic 3.3% |
| Assyrians/Chaldeans/Syriacs | 0.9 /100 | #244 | Tragic 3.3% |
| Immigrants | Scotland | 0.8 /100 | #245 | Tragic 3.3% |
Demographics Similar to Immigrants from Latin America by Hearing Disability
In terms of hearing disability, the demographic groups most similar to Immigrants from Latin America are Immigrants (2.8%, a difference of 0.060%), Immigrants from Liberia (2.8%, a difference of 0.15%), Zimbabwean (2.8%, a difference of 0.16%), Cambodian (2.8%, a difference of 0.17%), and Kenyan (2.8%, a difference of 0.18%).
| Demographics | Rating | Rank | Hearing Disability |
| Guatemalans | 93.2 /100 | #108 | Exceptional 2.8% |
| Turks | 93.0 /100 | #109 | Exceptional 2.8% |
| Cypriots | 92.9 /100 | #110 | Exceptional 2.8% |
| Immigrants | Yemen | 92.7 /100 | #111 | Exceptional 2.8% |
| U.S. Virgin Islanders | 92.5 /100 | #112 | Exceptional 2.8% |
| Immigrants | Belarus | 91.6 /100 | #113 | Exceptional 2.8% |
| Cambodians | 91.1 /100 | #114 | Exceptional 2.8% |
| Immigrants | Latin America | 90.5 /100 | #115 | Exceptional 2.8% |
| Immigrants | Immigrants | 90.3 /100 | #116 | Exceptional 2.8% |
| Immigrants | Liberia | 90.0 /100 | #117 | Excellent 2.8% |
| Zimbabweans | 89.9 /100 | #118 | Excellent 2.8% |
| Kenyans | 89.8 /100 | #119 | Excellent 2.8% |
| Jordanians | 89.5 /100 | #120 | Excellent 2.8% |
| Cubans | 89.4 /100 | #121 | Excellent 2.8% |
| Liberians | 89.0 /100 | #122 | Excellent 2.8% |