German Russian vs Vietnamese Disability
COMPARE
German Russian
Vietnamese
Disability
Disability Comparison
German Russians
Vietnamese
12.3%
DISABILITY
0.8/ 100
METRIC RATING
254th/ 347
METRIC RANK
10.9%
DISABILITY
99.9/ 100
METRIC RATING
49th/ 347
METRIC RANK
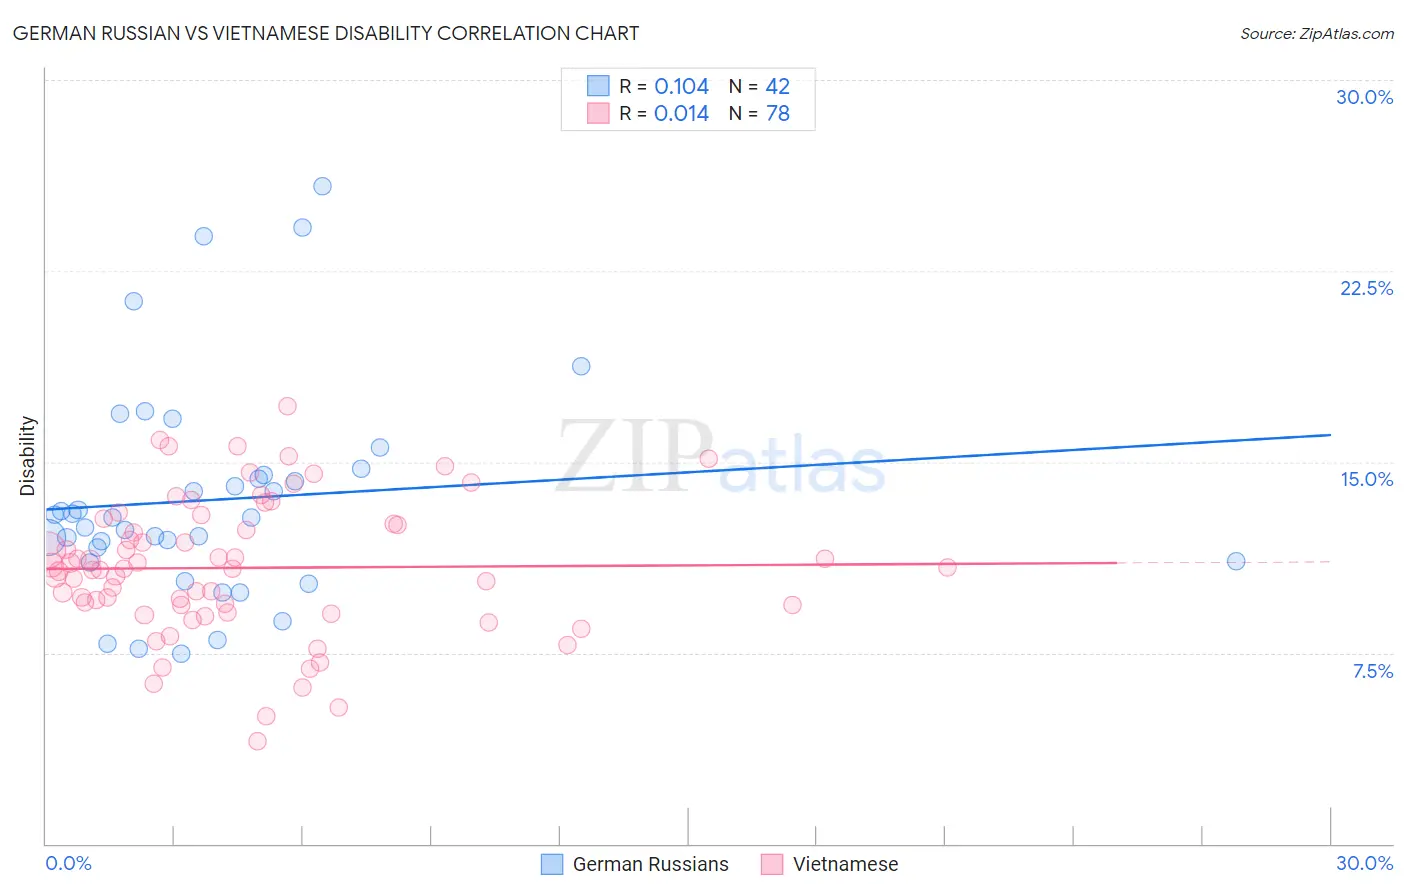
German Russian vs Vietnamese Disability Correlation Chart
The statistical analysis conducted on geographies consisting of 96,458,633 people shows a poor positive correlation between the proportion of German Russians and percentage of population with a disability in the United States with a correlation coefficient (R) of 0.104 and weighted average of 12.3%. Similarly, the statistical analysis conducted on geographies consisting of 170,758,607 people shows no correlation between the proportion of Vietnamese and percentage of population with a disability in the United States with a correlation coefficient (R) of 0.014 and weighted average of 10.9%, a difference of 13.5%.
Disability Correlation Summary
| Measurement | German Russian | Vietnamese |
| Minimum | 7.4% | 4.0% |
| Maximum | 25.8% | 17.2% |
| Range | 18.4% | 13.2% |
| Mean | 13.5% | 10.8% |
| Median | 12.8% | 10.8% |
| Interquartile 25% (IQ1) | 11.1% | 9.4% |
| Interquartile 75% (IQ3) | 14.5% | 12.6% |
| Interquartile Range (IQR) | 3.4% | 3.2% |
| Standard Deviation (Sample) | 4.2% | 2.7% |
| Standard Deviation (Population) | 4.2% | 2.7% |
Similar Demographics by Disability
Demographics Similar to German Russians by Disability
In terms of disability, the demographic groups most similar to German Russians are Belgian (12.3%, a difference of 0.030%), Bermudan (12.3%, a difference of 0.33%), Slovene (12.4%, a difference of 0.33%), Immigrants from Dominica (12.4%, a difference of 0.39%), and Immigrants from Laos (12.4%, a difference of 0.49%).
| Demographics | Rating | Rank | Disability |
| Indonesians | 1.4 /100 | #247 | Tragic 12.2% |
| Guamanians/Chamorros | 1.4 /100 | #248 | Tragic 12.3% |
| Carpatho Rusyns | 1.4 /100 | #249 | Tragic 12.3% |
| Sub-Saharan Africans | 1.4 /100 | #250 | Tragic 12.3% |
| Europeans | 1.4 /100 | #251 | Tragic 12.3% |
| Bermudans | 1.1 /100 | #252 | Tragic 12.3% |
| Belgians | 0.8 /100 | #253 | Tragic 12.3% |
| German Russians | 0.8 /100 | #254 | Tragic 12.3% |
| Slovenes | 0.6 /100 | #255 | Tragic 12.4% |
| Immigrants | Dominica | 0.6 /100 | #256 | Tragic 12.4% |
| Immigrants | Laos | 0.5 /100 | #257 | Tragic 12.4% |
| Slavs | 0.5 /100 | #258 | Tragic 12.4% |
| Canadians | 0.4 /100 | #259 | Tragic 12.4% |
| Immigrants | Liberia | 0.4 /100 | #260 | Tragic 12.4% |
| Scandinavians | 0.4 /100 | #261 | Tragic 12.4% |
Demographics Similar to Vietnamese by Disability
In terms of disability, the demographic groups most similar to Vietnamese are Immigrants from Saudi Arabia (10.9%, a difference of 0.0%), Peruvian (10.9%, a difference of 0.010%), Soviet Union (10.9%, a difference of 0.060%), South American (10.9%, a difference of 0.070%), and Immigrants from Spain (10.9%, a difference of 0.090%).
| Demographics | Rating | Rank | Disability |
| Immigrants | Nepal | 99.9 /100 | #42 | Exceptional 10.8% |
| Israelis | 99.9 /100 | #43 | Exceptional 10.8% |
| Immigrants | Japan | 99.9 /100 | #44 | Exceptional 10.8% |
| Immigrants | Peru | 99.9 /100 | #45 | Exceptional 10.8% |
| Tongans | 99.9 /100 | #46 | Exceptional 10.8% |
| Taiwanese | 99.9 /100 | #47 | Exceptional 10.8% |
| Soviet Union | 99.9 /100 | #48 | Exceptional 10.9% |
| Vietnamese | 99.9 /100 | #49 | Exceptional 10.9% |
| Immigrants | Saudi Arabia | 99.9 /100 | #50 | Exceptional 10.9% |
| Peruvians | 99.8 /100 | #51 | Exceptional 10.9% |
| South Americans | 99.8 /100 | #52 | Exceptional 10.9% |
| Immigrants | Spain | 99.8 /100 | #53 | Exceptional 10.9% |
| Jordanians | 99.8 /100 | #54 | Exceptional 10.9% |
| Immigrants | El Salvador | 99.8 /100 | #55 | Exceptional 10.9% |
| Immigrants | Lithuania | 99.8 /100 | #56 | Exceptional 10.9% |