French vs Immigrants from Portugal Ambulatory Disability
COMPARE
French
Immigrants from Portugal
Ambulatory Disability
Ambulatory Disability Comparison
French
Immigrants from Portugal
6.6%
AMBULATORY DISABILITY
0.1/ 100
METRIC RATING
269th/ 347
METRIC RANK
6.5%
AMBULATORY DISABILITY
1.4/ 100
METRIC RATING
248th/ 347
METRIC RANK
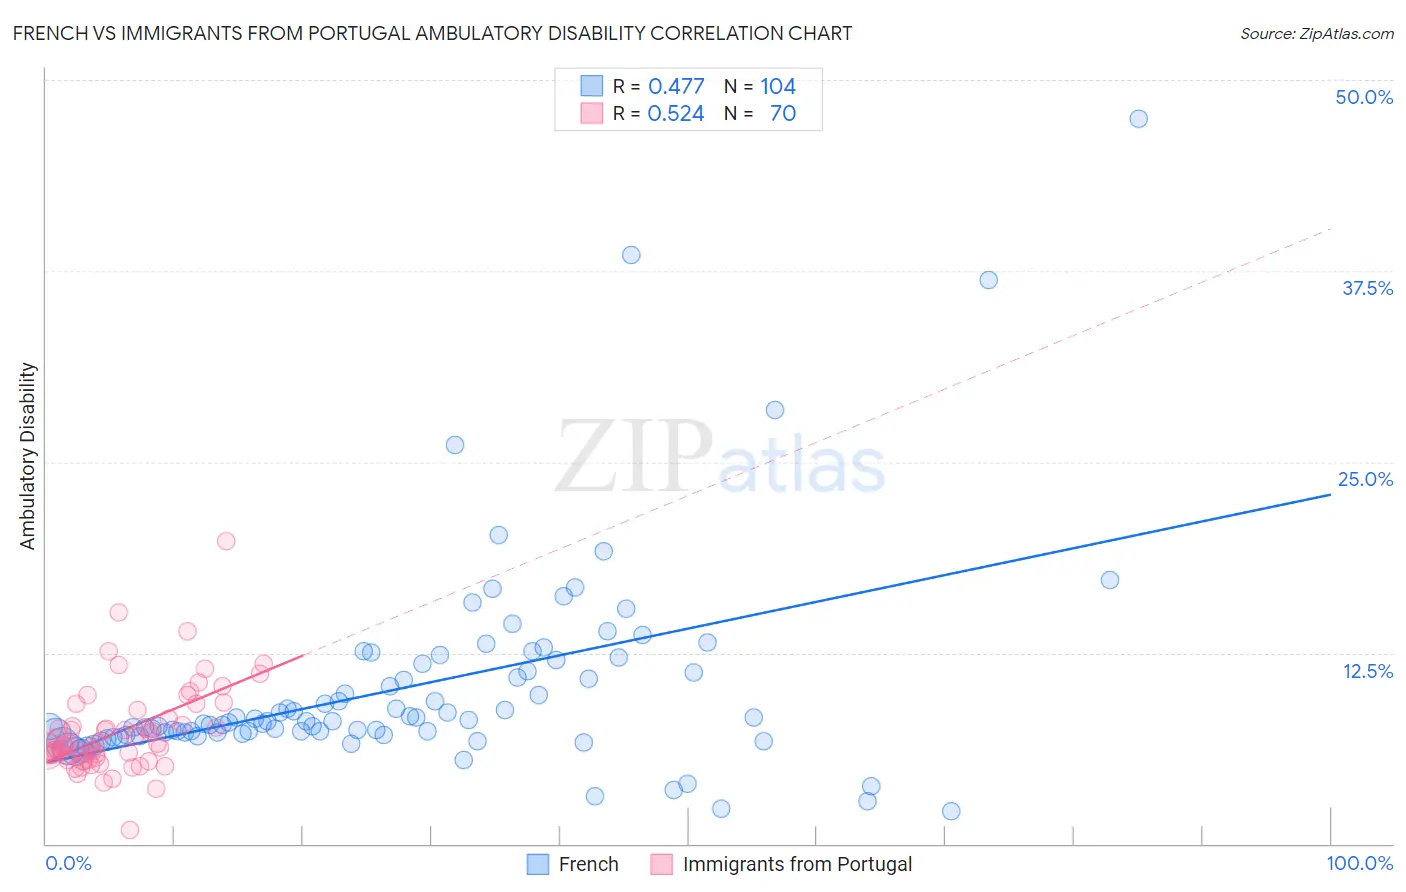
French vs Immigrants from Portugal Ambulatory Disability Correlation Chart
The statistical analysis conducted on geographies consisting of 571,874,701 people shows a moderate positive correlation between the proportion of French and percentage of population with ambulatory disability in the United States with a correlation coefficient (R) of 0.477 and weighted average of 6.6%. Similarly, the statistical analysis conducted on geographies consisting of 174,768,730 people shows a substantial positive correlation between the proportion of Immigrants from Portugal and percentage of population with ambulatory disability in the United States with a correlation coefficient (R) of 0.524 and weighted average of 6.5%, a difference of 2.9%.
Ambulatory Disability Correlation Summary
| Measurement | French | Immigrants from Portugal |
| Minimum | 2.1% | 0.93% |
| Maximum | 47.5% | 19.8% |
| Range | 45.4% | 18.9% |
| Mean | 10.2% | 7.3% |
| Median | 8.0% | 6.5% |
| Interquartile 25% (IQ1) | 7.2% | 5.7% |
| Interquartile 75% (IQ3) | 11.6% | 8.2% |
| Interquartile Range (IQR) | 4.4% | 2.5% |
| Standard Deviation (Sample) | 6.9% | 2.9% |
| Standard Deviation (Population) | 6.8% | 2.9% |
Similar Demographics by Ambulatory Disability
Demographics Similar to French by Ambulatory Disability
In terms of ambulatory disability, the demographic groups most similar to French are Slovak (6.7%, a difference of 0.16%), Immigrants from Trinidad and Tobago (6.7%, a difference of 0.26%), Spanish (6.6%, a difference of 0.31%), Trinidadian and Tobagonian (6.6%, a difference of 0.32%), and Guyanese (6.6%, a difference of 0.45%).
| Demographics | Rating | Rank | Ambulatory Disability |
| English | 0.4 /100 | #262 | Tragic 6.6% |
| Hmong | 0.3 /100 | #263 | Tragic 6.6% |
| Nepalese | 0.2 /100 | #264 | Tragic 6.6% |
| Bahamians | 0.2 /100 | #265 | Tragic 6.6% |
| Guyanese | 0.2 /100 | #266 | Tragic 6.6% |
| Trinidadians and Tobagonians | 0.2 /100 | #267 | Tragic 6.6% |
| Spanish | 0.2 /100 | #268 | Tragic 6.6% |
| French | 0.1 /100 | #269 | Tragic 6.6% |
| Slovaks | 0.1 /100 | #270 | Tragic 6.7% |
| Immigrants | Trinidad and Tobago | 0.1 /100 | #271 | Tragic 6.7% |
| French Canadians | 0.1 /100 | #272 | Tragic 6.7% |
| Whites/Caucasians | 0.1 /100 | #273 | Tragic 6.7% |
| Sioux | 0.1 /100 | #274 | Tragic 6.7% |
| Immigrants | Guyana | 0.1 /100 | #275 | Tragic 6.7% |
| Celtics | 0.1 /100 | #276 | Tragic 6.7% |
Demographics Similar to Immigrants from Portugal by Ambulatory Disability
In terms of ambulatory disability, the demographic groups most similar to Immigrants from Portugal are Immigrants from Cuba (6.5%, a difference of 0.020%), Armenian (6.5%, a difference of 0.070%), Tlingit-Haida (6.5%, a difference of 0.090%), German (6.5%, a difference of 0.12%), and Immigrants from Panama (6.5%, a difference of 0.12%).
| Demographics | Rating | Rank | Ambulatory Disability |
| Immigrants | Haiti | 1.6 /100 | #241 | Tragic 6.5% |
| Spaniards | 1.6 /100 | #242 | Tragic 6.5% |
| Germans | 1.5 /100 | #243 | Tragic 6.5% |
| Immigrants | Panama | 1.5 /100 | #244 | Tragic 6.5% |
| Tlingit-Haida | 1.5 /100 | #245 | Tragic 6.5% |
| Armenians | 1.5 /100 | #246 | Tragic 6.5% |
| Immigrants | Cuba | 1.4 /100 | #247 | Tragic 6.5% |
| Immigrants | Portugal | 1.4 /100 | #248 | Tragic 6.5% |
| Native Hawaiians | 1.1 /100 | #249 | Tragic 6.5% |
| Chinese | 1.0 /100 | #250 | Tragic 6.5% |
| Hawaiians | 0.9 /100 | #251 | Tragic 6.5% |
| Immigrants | Bahamas | 0.8 /100 | #252 | Tragic 6.5% |
| Scottish | 0.7 /100 | #253 | Tragic 6.5% |
| Belizeans | 0.7 /100 | #254 | Tragic 6.5% |
| Welsh | 0.6 /100 | #255 | Tragic 6.5% |