French American Indian vs Lebanese Hearing Disability
COMPARE
French American Indian
Lebanese
Hearing Disability
Hearing Disability Comparison
French American Indians
Lebanese
3.6%
HEARING DISABILITY
0.0/ 100
METRIC RATING
280th/ 347
METRIC RANK
3.2%
HEARING DISABILITY
5.0/ 100
METRIC RATING
226th/ 347
METRIC RANK
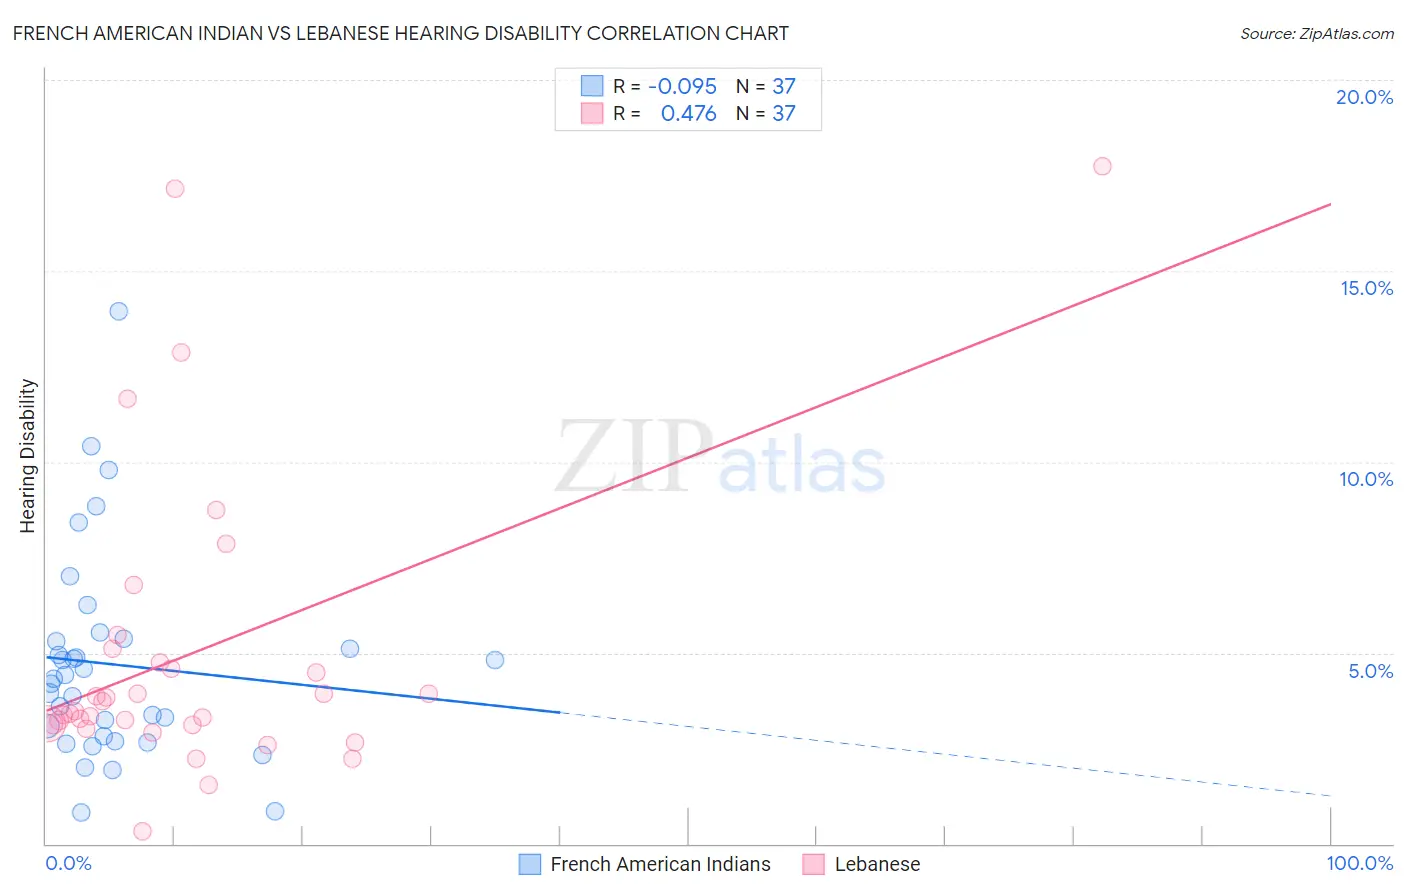
French American Indian vs Lebanese Hearing Disability Correlation Chart
The statistical analysis conducted on geographies consisting of 131,957,139 people shows a slight negative correlation between the proportion of French American Indians and percentage of population with hearing disability in the United States with a correlation coefficient (R) of -0.095 and weighted average of 3.6%. Similarly, the statistical analysis conducted on geographies consisting of 401,493,679 people shows a moderate positive correlation between the proportion of Lebanese and percentage of population with hearing disability in the United States with a correlation coefficient (R) of 0.476 and weighted average of 3.2%, a difference of 12.6%.
Hearing Disability Correlation Summary
| Measurement | French American Indian | Lebanese |
| Minimum | 0.83% | 0.31% |
| Maximum | 14.0% | 17.8% |
| Range | 13.1% | 17.4% |
| Mean | 4.7% | 5.0% |
| Median | 4.3% | 3.5% |
| Interquartile 25% (IQ1) | 2.8% | 3.1% |
| Interquartile 75% (IQ3) | 5.3% | 4.9% |
| Interquartile Range (IQR) | 2.6% | 1.8% |
| Standard Deviation (Sample) | 2.7% | 3.9% |
| Standard Deviation (Population) | 2.7% | 3.9% |
Similar Demographics by Hearing Disability
Demographics Similar to French American Indians by Hearing Disability
In terms of hearing disability, the demographic groups most similar to French American Indians are Scandinavian (3.6%, a difference of 0.060%), Slovak (3.6%, a difference of 0.070%), Swedish (3.6%, a difference of 0.15%), Basque (3.6%, a difference of 0.33%), and Blackfeet (3.6%, a difference of 0.40%).
| Demographics | Rating | Rank | Hearing Disability |
| Puerto Ricans | 0.0 /100 | #273 | Tragic 3.5% |
| Swiss | 0.0 /100 | #274 | Tragic 3.5% |
| Czechoslovakians | 0.0 /100 | #275 | Tragic 3.6% |
| Danes | 0.0 /100 | #276 | Tragic 3.6% |
| Immigrants | Nonimmigrants | 0.0 /100 | #277 | Tragic 3.6% |
| Basques | 0.0 /100 | #278 | Tragic 3.6% |
| Slovaks | 0.0 /100 | #279 | Tragic 3.6% |
| French American Indians | 0.0 /100 | #280 | Tragic 3.6% |
| Scandinavians | 0.0 /100 | #281 | Tragic 3.6% |
| Swedes | 0.0 /100 | #282 | Tragic 3.6% |
| Blackfeet | 0.0 /100 | #283 | Tragic 3.6% |
| Immigrants | Micronesia | 0.0 /100 | #284 | Tragic 3.6% |
| Sioux | 0.0 /100 | #285 | Tragic 3.6% |
| Delaware | 0.0 /100 | #286 | Tragic 3.6% |
| Spanish | 0.0 /100 | #287 | Tragic 3.7% |
Demographics Similar to Lebanese by Hearing Disability
In terms of hearing disability, the demographic groups most similar to Lebanese are Latvian (3.2%, a difference of 0.040%), Icelander (3.2%, a difference of 0.090%), Bhutanese (3.2%, a difference of 0.18%), Mexican (3.2%, a difference of 0.25%), and Immigrants from Portugal (3.2%, a difference of 0.38%).
| Demographics | Rating | Rank | Hearing Disability |
| New Zealanders | 6.8 /100 | #219 | Tragic 3.2% |
| Malaysians | 6.6 /100 | #220 | Tragic 3.2% |
| Immigrants | Laos | 6.6 /100 | #221 | Tragic 3.2% |
| Immigrants | Oceania | 6.5 /100 | #222 | Tragic 3.2% |
| Mexicans | 5.6 /100 | #223 | Tragic 3.2% |
| Icelanders | 5.2 /100 | #224 | Tragic 3.2% |
| Latvians | 5.1 /100 | #225 | Tragic 3.2% |
| Lebanese | 5.0 /100 | #226 | Tragic 3.2% |
| Bhutanese | 4.6 /100 | #227 | Tragic 3.2% |
| Immigrants | Portugal | 4.3 /100 | #228 | Tragic 3.2% |
| Maltese | 4.1 /100 | #229 | Tragic 3.2% |
| Greeks | 3.2 /100 | #230 | Tragic 3.2% |
| Luxembourgers | 2.9 /100 | #231 | Tragic 3.2% |
| Ukrainians | 2.9 /100 | #232 | Tragic 3.2% |
| Estonians | 2.4 /100 | #233 | Tragic 3.3% |