French American Indian vs Russian Professional Degree
COMPARE
French American Indian
Russian
Professional Degree
Professional Degree Comparison
French American Indians
Russians
3.8%
PROFESSIONAL DEGREE
1.7/ 100
METRIC RATING
245th/ 347
METRIC RANK
6.3%
PROFESSIONAL DEGREE
100.0/ 100
METRIC RATING
23rd/ 347
METRIC RANK
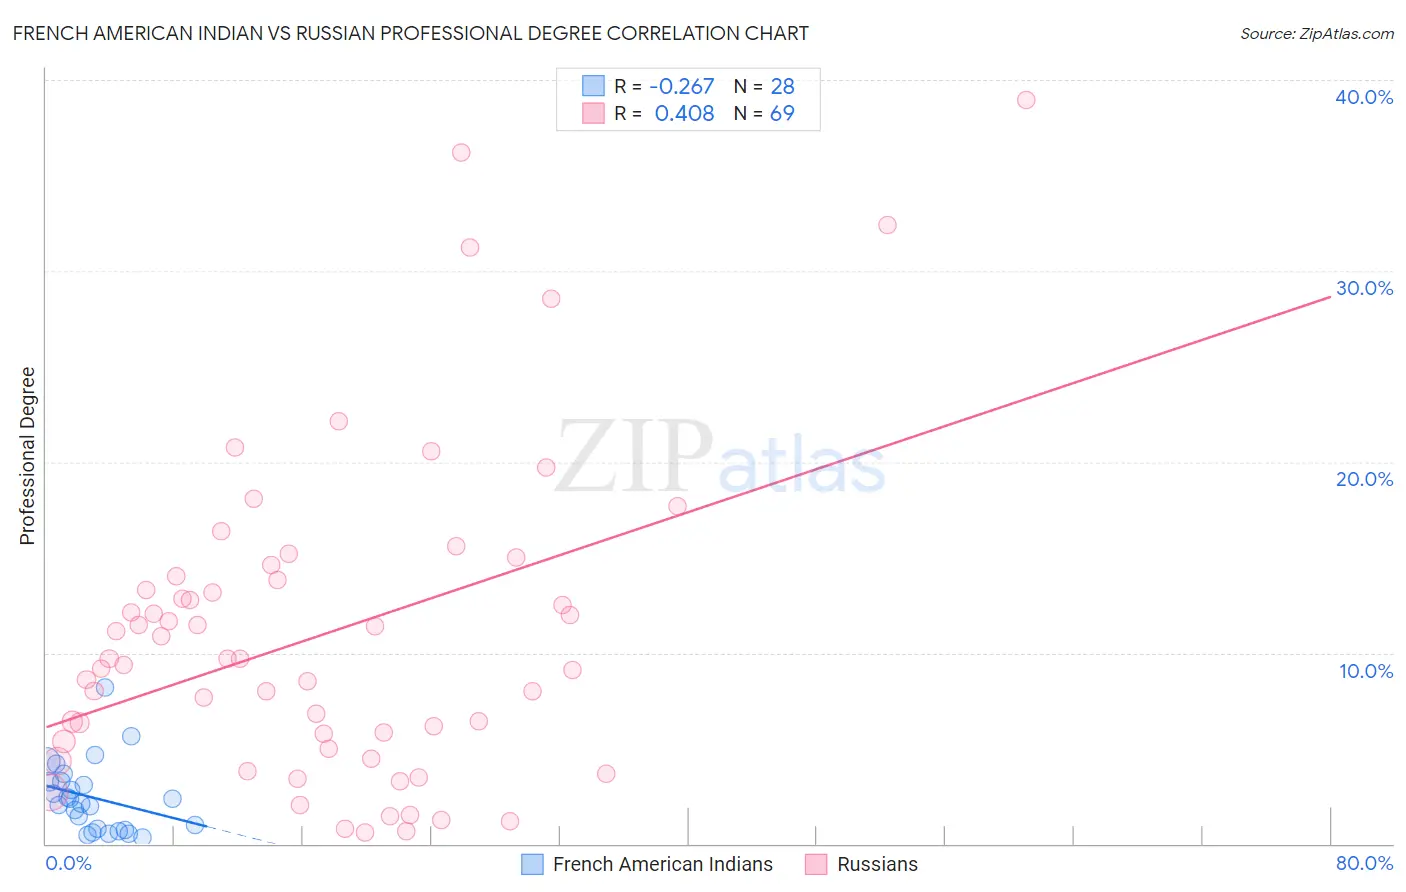
French American Indian vs Russian Professional Degree Correlation Chart
The statistical analysis conducted on geographies consisting of 131,791,322 people shows a weak negative correlation between the proportion of French American Indians and percentage of population with at least professional degree education in the United States with a correlation coefficient (R) of -0.267 and weighted average of 3.8%. Similarly, the statistical analysis conducted on geographies consisting of 509,341,332 people shows a moderate positive correlation between the proportion of Russians and percentage of population with at least professional degree education in the United States with a correlation coefficient (R) of 0.408 and weighted average of 6.3%, a difference of 68.5%.
Professional Degree Correlation Summary
| Measurement | French American Indian | Russian |
| Minimum | 0.35% | 0.56% |
| Maximum | 8.2% | 39.0% |
| Range | 7.8% | 38.4% |
| Mean | 2.4% | 11.0% |
| Median | 2.2% | 9.7% |
| Interquartile 25% (IQ1) | 0.74% | 5.2% |
| Interquartile 75% (IQ3) | 3.3% | 13.9% |
| Interquartile Range (IQR) | 2.5% | 8.7% |
| Standard Deviation (Sample) | 1.8% | 8.3% |
| Standard Deviation (Population) | 1.8% | 8.3% |
Similar Demographics by Professional Degree
Demographics Similar to French American Indians by Professional Degree
In terms of professional degree, the demographic groups most similar to French American Indians are Marshallese (3.8%, a difference of 0.17%), Guyanese (3.8%, a difference of 0.20%), Hmong (3.7%, a difference of 0.36%), Immigrants from Grenada (3.7%, a difference of 0.47%), and Immigrants from Fiji (3.7%, a difference of 0.53%).
| Demographics | Rating | Rank | Professional Degree |
| Colville | 2.6 /100 | #238 | Tragic 3.8% |
| British West Indians | 2.4 /100 | #239 | Tragic 3.8% |
| Immigrants | Ecuador | 2.3 /100 | #240 | Tragic 3.8% |
| Alaskan Athabascans | 2.3 /100 | #241 | Tragic 3.8% |
| Native Hawaiians | 2.3 /100 | #242 | Tragic 3.8% |
| Guamanians/Chamorros | 2.2 /100 | #243 | Tragic 3.8% |
| Immigrants | Bahamas | 2.0 /100 | #244 | Tragic 3.8% |
| French American Indians | 1.7 /100 | #245 | Tragic 3.8% |
| Marshallese | 1.7 /100 | #246 | Tragic 3.8% |
| Guyanese | 1.6 /100 | #247 | Tragic 3.8% |
| Hmong | 1.6 /100 | #248 | Tragic 3.7% |
| Immigrants | Grenada | 1.5 /100 | #249 | Tragic 3.7% |
| Immigrants | Fiji | 1.5 /100 | #250 | Tragic 3.7% |
| Immigrants | Nicaragua | 1.4 /100 | #251 | Tragic 3.7% |
| Jamaicans | 1.4 /100 | #252 | Tragic 3.7% |
Demographics Similar to Russians by Professional Degree
In terms of professional degree, the demographic groups most similar to Russians are Immigrants from Spain (6.3%, a difference of 0.040%), Immigrants from Japan (6.4%, a difference of 0.48%), Immigrants from Ireland (6.3%, a difference of 0.53%), Immigrants from Hong Kong (6.4%, a difference of 1.2%), and Latvian (6.2%, a difference of 1.4%).
| Demographics | Rating | Rank | Professional Degree |
| Immigrants | Sweden | 100.0 /100 | #16 | Exceptional 6.7% |
| Immigrants | Eastern Asia | 100.0 /100 | #17 | Exceptional 6.6% |
| Soviet Union | 100.0 /100 | #18 | Exceptional 6.6% |
| Indians (Asian) | 100.0 /100 | #19 | Exceptional 6.5% |
| Immigrants | Denmark | 100.0 /100 | #20 | Exceptional 6.4% |
| Immigrants | Hong Kong | 100.0 /100 | #21 | Exceptional 6.4% |
| Immigrants | Japan | 100.0 /100 | #22 | Exceptional 6.4% |
| Russians | 100.0 /100 | #23 | Exceptional 6.3% |
| Immigrants | Spain | 100.0 /100 | #24 | Exceptional 6.3% |
| Immigrants | Ireland | 100.0 /100 | #25 | Exceptional 6.3% |
| Latvians | 100.0 /100 | #26 | Exceptional 6.2% |
| Immigrants | Northern Europe | 100.0 /100 | #27 | Exceptional 6.2% |
| Turks | 100.0 /100 | #28 | Exceptional 6.2% |
| Immigrants | Sri Lanka | 100.0 /100 | #29 | Exceptional 6.2% |
| Immigrants | Turkey | 100.0 /100 | #30 | Exceptional 6.2% |